Lecture theatre image by judy dean
I’ve now been teaching data journalism for over a decade — from one-off guest classes at universities with no internal data journalism expertise, to entire courses dedicated to the field. In the first of two extracts from a commentary I was asked to write for Asia Pacific Media Educator I reflect on the lessons I’ve learned, and the differences between what I describe (after Daniel Kahneman) as “teaching data journalism fast” and “teaching data journalism slow”. First up, ‘teaching data journalism fast‘ — techniques for one-off data journalism classes aimed at general journalism students.
Like a gas, data journalism teaching will expand to fill whatever space is allocated to it. Educators can choose to focus on data journalism as a set of practices, a form of journalistic output, a collection of infrastructure or inputs, or a culture (see also Karlsen and Stavelin 2014; Lewis and Usher 2014; Boyles and Meyer 2016). Or, they might choose to spend all their time arguing over what we mean by ‘data journalism’ in the first place.
We can choose to look to the past of Computer Assisted Reporting and Precision Journalism, emerging developments around computational and augmented journalism, and everything that has happened in between.
In this commentary, I outline the different pedagogical approaches I have adopted in teaching data journalism within different contexts over the last decade. In each case, there was more than enough data journalism to fill the space — the question was how to decide which bits to leave out, and how to engage students in the process.
Teaching data journalism — fast
In 2010 at the start of a class at a London university I asked the room — over 150 postgraduate students from a dozen different journalism courses — how many had studied a humanities subject such as English or History in their undergraduate studies.
Most of the hands shot up.
Then I asked a second question: how many had chosen to study maths, a science, or computing?
This time the number of arms going up was in single figures — a significant minority.
It is widely recognised that the typical journalism student does not begin their education with an innate interest in numbers. This is no surprise: journalism after all is seen as a craft that revolves around words and storytelling; and journalism students stereotypically aspire to be in front of the camera, not under the hood of a webpage.
Teachers of data journalism will be familiar with the complaint from students that “I’m not good at maths” or (perhaps more worryingly) “I’m not good with technology”.
Data journalism, then, starts at a disadvantage: its biggest names — the likes of Philip Meyer (see video below), Adrian Holovaty and Nate Silver— are not names most students would recognise. And big data stories such as the Wikileaks revelations, Panama Papers, and the MPs’ expenses scandal in the UK seem impenetrable and unreachable for the average 19- or 21-year-old; something for ‘later’.
Objective 1: Challenging preconceptions
The first objective in any data journalism class, then, is to challenge any preconceptions that students might have about the discipline, and lower the barriers that make it seem otherworldly; to show that it is not something for ‘someone else’ or ‘another time’. That it is, instead, a practice at the core of journalistic practice.
Data journalism itself is a broad church — much broader than its predecessor Computer Assisted Reporting — so it is important to show a wide range of examples of data journalism that students can engage with.
Yes there are the seminal examples mentioned above, but also articles that every journalist needs to write about the latest round of school performance data, or crime statistics.
There are articles from newspapers and online-only publications, but also radio stories and TV stories where the data work might not be so immediately obvious.
And there are entertaining and engaging data features from fashion, music, film and sport as well as hard news.
Introducing data journalism in this way – and connecting it with students’ interests – helps establish an opportunity for students to make data journalism relevant to their own interests, rather than make them feel that they are going through the motions for our sake as academics. Ultimately we are hoping to pique their curiosity.
Method: Starting at the end
For many years I began my introductory data journalism classes with basic spreadsheet techniques, followed by visualization sessions to show them how to bring some of the results to life.
In 2016, however, I decided to try something different: what if, instead of taking students through the process chronologically, we started at the end — and worked backwards from there?
The class worked like this: students were given a spreadsheet of several tables already ready to be turned into a chart (I chose data on the Oscars, because it was around the time of the awards ceremony and because it was not hard news).
They were then shown how to use an online visualization tool (such as Datawrapper or Infogram) to turn that into something that could illustrate a news story or broadcast about the forthcoming awards.
Rather than worrying about numbers, they could focus on storytelling:
- Would they tell a story about gender, or ethnicity, religion or money?
- What type of chart would they choose?
- How would they use colour?
The process only took 30-60 minutes, but it served to establish something important: motivation. Once students could see the end result, and get excited about the effect of different colour combinations or animations, they would be in a much more receptive mindset to begin learning the techniques that could help them get the data in a convenient format in the first place.
In the second part of the class, then, we began to learn spreadsheet techniques such as aggregating figures using pivot tables, and calculating percentages.
The point was made: this wasn’t maths — this was finding stories to tell.
To support students’ learning, I also wrote the short ebook Data Journalism Heist and gave them access to the full text. As the title suggests, the intention was to provide skills which could be learned in 3 hours and would allow beginners to “get in, get the data, and get the story out – and make sure nobody gets hurt”.
Objective 2: Put data journalism into context

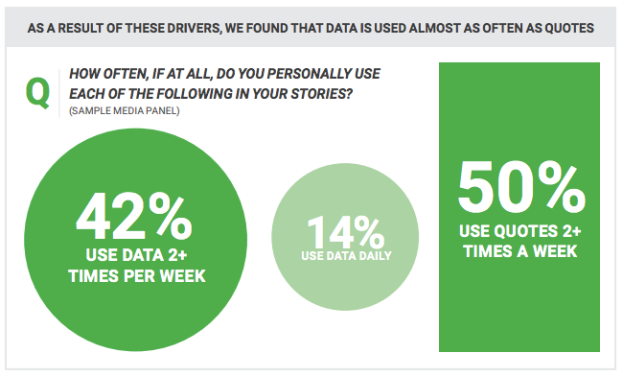
Chart from Google News Lab’s Data Journalism in 2017 report
While there is a growing need for journalists with specialist data skills, a significant proportion of other journalists use data journalism techniques as part of routine work (PDF). A reporter on a fashion magazine, for example, may need data skills to understand some trend reports; a newspaper journalist may need to be able to show which local schools have dropped furthest in the latest rankings, or to factcheck the claims of a local politician; a researcher on a TV programme may need them to provide a background briefing, or to analyse FOI responses.
Similarly, with many journalism students aspiring to work in magazines or present broadcast bulletins, it makes most sense to teach data journalism within those contexts (the exception, specialist courses, is covered in the second part of this series).
For this reason I have always taught data journalism at undergraduate level within a broader context: for many years within a module on ‘online journalism’, then within a module on ‘specialist reporting’. And from 2020 it will be also taught in a new module on ‘investigations and campaigning journalism’.
These changes reflect the changing contexts of the practice as it has become increasingly integral to specialist and investigative reporting.
The principle is similar to that outlined above:
- Establish a motivation for telling a particular story;
- Present a problem (“I need to find out whether this issue is getting better or worse”);
- Then give them a solution to that problem, i.e. data journalism techniques.
FOI and hackdays as pedagogical tools

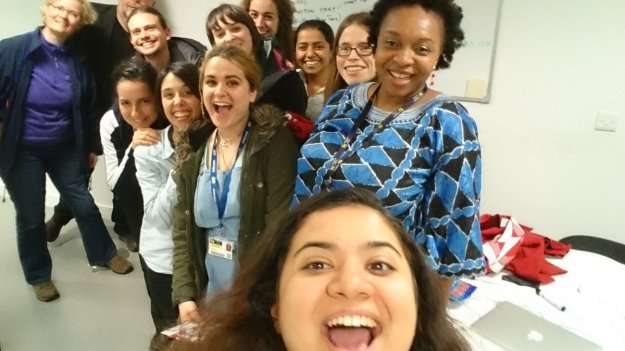
Hack days are one method in teaching data journalism ‘fast’ — this one brought together BA students, MA students, members of the Hacks/Hackers meetup group, Finance Uncovered and OpenCorporates
Freedom of Information is one obvious way to provide an urgency to learn data skills: in that Specialist Reporting module, for example, students are supported in sending their own FOI request in their first week. When, later in the module, they have received the results of that request, it provides a pedagogical opportunity to introduce those data skills — not as an abstract exercise, but as something which comes about naturally through student enquiry (“How do I turn this response into a story I can tell?”).
A similar context can be provided by hackdays, especially when done in partnership with media organisations.
Hackdays — events whereby participants collaborate on projects over a short period — are often designed to bring together people from different disciplines to create an editorial product, and they are increasingly regularly used within the news industry.
In 2015, for example, as a general election approached, I organized an election hackday to bring together BBC journalists, journalism students, and members of a local Hacks/Hackers Meetup group.
The condensed time period helps give focus to students’ efforts, while the loose structure of hackday events removes some of the pressures towards over-ambition: the point of the ‘hack’ in hackday is that results are expected to be rough-and-ready and not perfect (participants can then decide whether to pursue them further), and participants are expected to bring a diversity of skills and abilities: some will have technical skills but others will bring editorial focus or expertise.
The professional context adds further motivation, but there is another important result of collaborating with media organisations too: although students often arrive fearing that their skills fall short of those in the industry, they leave learning that the opposite is true: journalists working in the news industry invariably learn more from the students at these events than vice versa.
The student realizes that even their rudimentary data skills actually have value, and what’s more: they set them apart in their interactions with professionals.
All of this involves technical challenges — but so does broadcast journalism, or writing news articles. If students are prepared to learn about white balance, audio levels, and focus, or the demands of the inverted pyramid and the nut graf, then asking them to learn about pivot tables or how to calculate a percentage drop is entirely reasonable, and we should not apologise for doing so.
In the second part of this commentary, published tomorrow, I look at ‘teaching data journalism slow’: designing courses dedicated to data journalism as a specialist skill.

Pingback: Designing data journalism courses: reflections on a decade of teaching | Online Journalism Blog