Monthly Archives: May 2020

How Wayback Machine and a sitemap file was used to factcheck Dominic Cummmings

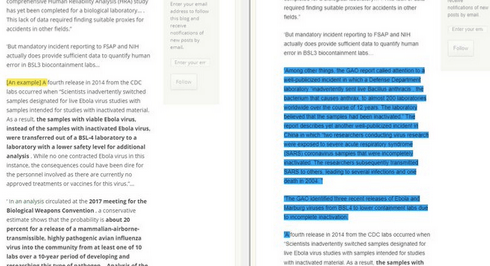
Before and after images of Cummings' blog post text

Among the many claims made by UK Government adviser Dominic Cummings in his press conference on Monday was one that could be easily checked.

As evidence that he took the threat from coronavirus seriously he said that he’d written about the danger of coronaviruses last year.

“For years I’ve warned of the dangers of pandemics. Last year I wrote about the possible threat of coronaviruses and the urgent need for planning.”

Before the press conference was over, that claim had already been proven to be false, thanks to some underused journalistic tools of verification: the Wayback Machine and sitemap.

Here’s how it was done — and how journalists can use the same tools in their work, whether it’s to verify a claim made about the past, a claim about what was not said in the past, or to uncover details that may have been unwittingly revealed in earlier versions of webpages. Continue reading

Coronavirus: 3 ways journalists need to get to grips with uncertainty during the pandemic

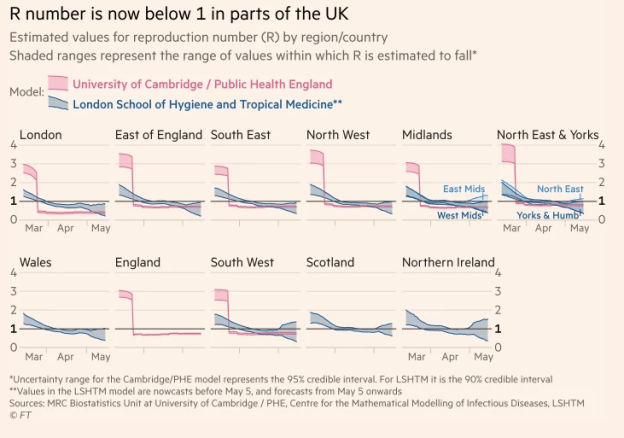
R number ranges in different UK regions

R number ranges shown by the FT

Journalism doesn’t like uncertainty: editors are trained to cut out vagueness and journalists taught to be as concrete as possible in their reporting. In most cases it compels reporters to ensure they have a firm grip on the details and are confident in the story they are reporting.

But with coronavirus, this discipline becomes a systemic blind spot.

From prevalence to testing, and from deaths to infection rates, the story of this pandemic is full of uncertainty. Here, then, are 3 ways that journalists need to understand — and better communicate — the things that we don’t know, and won’t know, about it. Continue reading

How to brainstorm COVID-19 data story ideas

Reporting beyond the case numbers: How to brainstorm COVID-19 data story ideas

I’ve written a piece for DataJournalism.com on covering the societal impact of a pandemic with data — it covers:

  • Stories to report in the short term
  • Moving beyond health stories
  • Looking for stories about changing behaviour
  • Thinking creatively about data
  • Stories from historical data
  • Interactivity as a data angle
  • Looking and planning ahead

How should journalists report “fiddling the figures” on coronavirus tests?

The BBC’s live stream included an alert that 122,347 tests had been “carried out” yesterday. In fact 40,000 of those had merely been sent out.

When a prominent UK politician announced on live TV that the Government had hit its target of 100,000 coronavirus tests a day by the end of April, on the very last day of that month no less, journalists faced a challenge.

Two hours earlier, specialist publication Health Service Journal had revealed that the figures had been fudged: instead of counting the numbers of tests that had been conducted on samples, a source informed them, the Government had quietly changed its own metric so that a test that had been sent out in the post — and not returned or tested — could now be added to the figures.

40,000 tests were then sent out in one day.

By any reasonable understanding, a test sent was not the same thing as a test done, as a raft of jokes — from people saying they had marked their students’ homework by sticking it in the mail, or paid their tax by receiving a letter from the taxman — pointed out.

And yet there was the Government making its claim — at length and without question, on the national broadcaster, and on the websites of national news organisations.

It was 20 minutes before the claim was queried by a reporter, by which time many viewers had switched off.

How journalists responded to this announcement — in different ways, at different times, and in different places — provides a valuable case study for anyone dealing with numbers and the claims that politicans make about them. Continue reading