Monthly Archives: July 2012

Data Shaping in Google Refine – Generating New Rows from Multiple Values in a Single Column

One of the things I’ve kept stumbling over in Google Refine is how to use it to reshape a data set, so I had a little play last week and worked out a couple of new (to me) recipes.

The first relates to reshaping data by creating new rows based on columns. For example, suppose we have a data set that has rows relating to Olympics events, and columns relating to Medals, with cell entries detailing the country that won each medal type:

However, suppose that you need to get the data into a different shape – maybe one line per country with an additional column specifying the medal type. Something like this, for example:

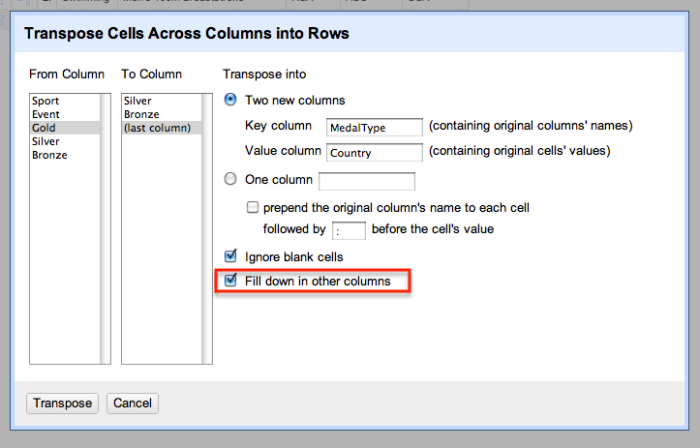
How can we generate that sort of view from the original data set? Here’s one way, that works when the columns you want to split into row values are contiguous (that is, next to each other). From the first column in the set of columns you want to be transformed, select Transpose > Transpose cells across columns into rows:

We now set the original selected column headers to be the cell value within a new column – MedalType – and the original cell values the value within a Country column:

(Note that we could also just transform the data into a single column. For example, suppose we had columns relating to courses currently taken by a particular student (Course 1, Course 2, Course 3), with a course code as cell value and one, two or three columns populated per student. If we wanted one row per student per course, we could just map the three columns onto a single column – CourseCode – and assign multiple rows to each student, then filtering out rows with a blank value in the CourseCOde column as required.)

Ticking the Fill down in other columns checkbox ensures that the appropriate Sport and Event values are copied in to the newly created rows:

Having worked out how to do that oft-required bit of data reshaping, I thought I could probably have another go at something that has been troubling me for ages – how to generate multiple rows from a single row where one of the columns contains JSON data (maybe pulled from a web service/API) that contains multiple items. This is a “mate in three” sort of problem, so here’s how I started to try to work it back. Given that I now know how to map columns onto rows, can I work out how to map different results in a JSON response onto different columns?

For example, here’s a result from the Facebook API for a search on a particular OU course code and the word open in a Facebook group name:

{“data”:[{“version”:1,”name”:”U101 (Open University) start date February 2012″,”id”:”325165900838311″},{“version”:1,”name”:”Open university, u101- design thinking, October 2011″,”id”:”250227311674865″},{“version”:1,”name”:”Feb 2011 Starters U101 Design Thinking – Open University”,”id”:”121552081246861″},{“version”:1,”name”:”Open University – U101 Design Thinking, Feburary 2011″,”id”:”167769429928476″}],”paging”:{“next”:…etc…}}

It returns a couple of results in the data element, in particular group name and group ID. Here’s one way I found of creating one row per group… Start off by creating a new column based on the JSON data column that parses the results in the data element into a list:

We can then iterate over the list items in this new column using the forEach grel command. The join command then joins the elements within each list item, specifically the group ID and name values in each result:

forEach(value.parseJson(),v,[v.id,v.name].join('||'))

You’ll notice that for multiple results, this produces a list of joined items, which we can also join together by extending the GREL expression:

forEach(value.parseJson(),v,[v.id,v.name].join('||')).join('::')

We now have a column that contains ‘||’ and ‘::’ separated items – :: separates individual group results from each other, || separates the id and name for each particular group.

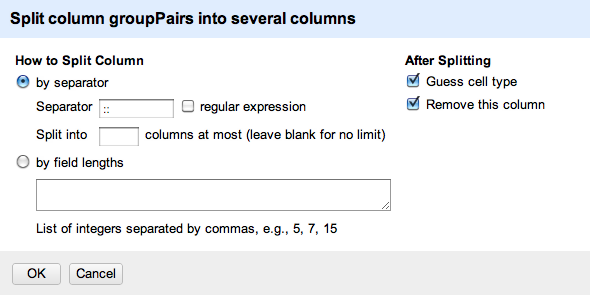
Given we know how to create rows from multiple columns, we could try to split this column into separate columns using Edit column > Split into separate columns. This would create one column per result, which we could then transform into rows, as we did above. Whilst I don’t recommend this route in this particular case, here’s how we could go about doing it…

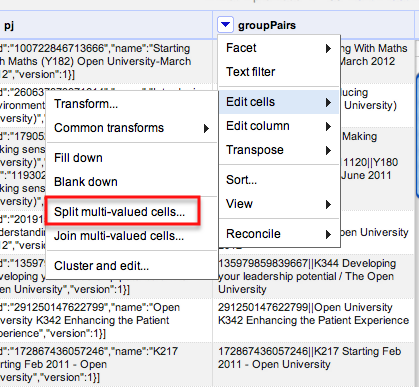
A far better approach is to use the Edit cells > split multi-valued cells option to automatically create new rows based on splitting the elements in a single column:

Note, however that this creates blanks in the other columns, so we need to Edit cells > Fill down to fill in the blanks in any other columns we want to refer to. After doing that, we end up with something like this:

We could now split the groupPairs column using the || separator to create two columns – Group ID and group name – giving us one row per group, and separate columns identifying the course, group name and group ID.

If the above route seems a little complicated, fear not…Once you apply it, it starts to make sense!

Interview: the team behind the Transcribe audio transcription app

After test-driving the audio transcription app Transcribe, Antoinette Siu interviewed Jason and Kishore of Wreally Studios, the team behind Transcribe.

What do you hope to do with this project?

We want to make journalists’ lives easier through software. From what we’ve heard, transcription is one of their pain points and while Transcribe can’t do the transcription automatically for them (at least, not yet) we could make the transcription process a little easier for them through our tool. Continue reading

Review: Transcribe – a free browser-based app to make audio transcription easier

Antoinette Siu takes a look at a new free app which promises to make transcribing audio easier.

Transcribing audio is one of the most time-consuming tasks in a journalist’s job. Switching between the audio player and the text editor, rewinding every 20 seconds in, typing frantically to catch every syllable—repeating these steps back and forth, and back and forth… in an age of so much automation, something isn’t quite right.

A new Chrome app tool called Transcribe lets you do all that in one screen. With keyboard shortcuts and an audio file uploader, you can easily go back and forth between your sound and text. Continue reading

Hyperlocal Voices: Richard Gurner, Caerphilly Observer

For the fourth in our new series of Hyperlocal Voices we head back to Wales. Launched by Richard Gurner in July 2009, the Caerphilly Observer acts as a local news and information website for Caerphilly County Borough.

The site is one of a small, but growing, number of financially viable hyperlocal websites. Richard, who remains the Editor of the site, told Damian Radcliffe a little bit about his journey over the last three years. Continue reading

Searching for a Map of Designated Public Places…

A discussion, earlier, about whether it was now illegal to drink in public…

…I thought not, think not, at least, not generally… My understanding was, that local authorities can set up controlled, alcohol free zones and create some sort of civil offence for being caught drinking alcohol there. (As it is, councils can set up regions where public consumption of alcohol may be prohibited and this prohibition may be enforced by the police.) So surely there must be an #opendata powered ‘no drinking here’ map around somewhere? The sort of thing that might result from a newspaper hack day, something that could provide a handy layer on a pub map? I couldn’t find one, though…

I did a websearch, turned up The Local Authorities (Alcohol Consumption in Designated Public Places) Regulations 2007, which does indeed appear to be the bit of legislation that regulates drinking alcohol in public, along with a link to a corresponding guidance note: Home Office circular 013 / 2007:

16. The provisions of the CJPA [Criminal Justice and Police Act 2001, Chapter 2 Provisions for combatting alcohol-related disorder] should not lead to a comprehensive ban on drinking in the open air.

17. It is the case that where there have been no problems of nuisance or annoyance to the public or disorder having been associated with drinking in that place, then a designation order … would not be appropriate. However, experience to date on introducing DPPOs has found that introducing an Order can lead to nuisance or annoyance to the public or disorder associated with public drinking being displaced into immediately adjacent areas that have not been designated for this purpose. … It might therefore be appropriate for a local authority to designate a public area beyond that which is experiencing the immediate problems caused by anti-social drinking if police evidence suggests that the existing problem is likely to be displaced once the DPPO was in place. In which case the designated area could include the area to which the existing problems might be displaced.

Creepy, creep, creep…

This, I thought, was interesting too, in the guidance note:

37. To ensure that the public have full access to information about designation orders made under section 13 of the Act and for monitoring arrangements, Regulation 9 requires all local authorities to send a copy of any designation order to the Secretary of State as soon as reasonably practicable after it has been made.

38. The Home Office will continue to maintain a list of all areas designated under the 2001 Act on the Home Office website: www.crimereduction.gov.uk/alcoholorders01.htm [I’m not convinced that URL works any more…?]

39. In addition, local authorities may wish to consider publicising designation orders made on their own websites, in addition to the publicity requirements of the accompanying Regulations, to help to ensure full public accessibility to this information.

So I’m thinking: this sort of thing could be a great candidate for a guidance note from the Home Office to local councils recommending ways of releasing information about the extent of designation orders as open geodata. (Related? Update from ONS on data interoperability (“Overcoming the incompatibility of statistical and geographic information systems”).)

I couldn’t immediately find a search on data.gov.uk that would turn up related datasets (though presumably the Home Office is aggregating this data, even if it’s just in a filing cabinet or mail folder somewhere*), but a quick websearch for Designated Public Places site:gov.uk intitle:council turned up a wide selection of local council websites along with their myriad ways of interpreting how to release the data. I’m not sure if any of them release the data as geodata, though? Maybe this would be an appropriate test of the scope of the Protection of Freedoms Act Part 6 regulations on the right to request data as data (I need to check them again…)?

* The Home Office did release a table of designated public places in response to an FOI request about designated public place orders, although not as data… But it got me wondering: if I scheduled a monthly FOI request to the Home Office requesting the data on a monthly basis, would they soon stop fulfilling the requests as timewasting? How about if we got a rota going?! Is there any notion of a longitudinal/persistent FOI request, that just keeps on giving (could I request the list of designated public places the Home Office has been informed about over the last year, along with a monthly update of requests in the previous month (or previous month but one, or whatever is reasonable…) over the next 18 months, or two years, or for the life of the regulation, or until such a time as the data is published as open data on a regular basis?

As for the report to government that a local authority must make on passing a designation order – 9. A copy of any order shall be sent to the Secretary of State as soon as reasonably practicable after it has been made. – it seems that how the area denoted as a public space is described is moot: “5. Before making an order, a local authority shall cause to be published in a newspaper circulating in its area a notice— (a)identifying specifically or by description the place proposed to be identified;“. Hmmm, two things jump out there…

Firstly, a local authority shall cause to be published in a newspaper circulating in its area [my emphasis; how is a newspaper circulating in its area defined? Do all areas of England have a non-national newspaper circulating in that area? Does this implicitly denote some “official channel” responsibility on local newspapers for the communication of local government notices?]. Hmmm…..

Secondly, the area identified specifically or by description. On commencement, the order must also be made public by “identifying the place which has been identified in the order”, again “in a newspaper circulating in its area”. But I wonder – is there an opportunity there to require something along the lines of and published using an appropriate open data standard in a open public data repository, and maybe further require that this open public data copy is the one that is used as part of the submission informing the Home Office about the regulation? And if we go overboard, how about we further require that each enacted and proposed order is published as such along with a machine readable geodata description and that a single aggregate files containing all that Local Authority’s currently and planned Designated Public Spaces are also published (so one URL for all current spaces, one for all planned ones). Just by the by, does anyone know of any local councils publishing boundary date/shapefiles that mark out their Designated Public Spaces? Please let me know via the comments, if so…

A couple of other, very loosely (alcohol) related, things I found along the way:

  • Local Alcohol Profiles for England: the aim appears to have been the collation of, and a way of exploring, a “national alcohol dataset”, that maps alcohol related health indicators on a PCT (Primary Care Trust) and LA (local authority) basis. What this immediately got me wondering was: did they produce any tooling, recipes or infrastructure that would it make a few clicks easy to pull together a national tobacco dataset and associated website, for example? And then I found the Local Tobacco Control Profiles for England toolkit on the London Health Observatory website, along with a load of other public health observatories and it made me remember – again – just how many data sensemaking websites there already are out there…
  • UK Alcohol Strategy – maybe some leads into other datasets/data stories?

PS I wonder if any of the London Boroughs or councils hosting regional events have recently declared any new Designated Public Spaces #becauseOfTheOlympics.

Scraping for Journalists – ebook out now

My ebook Scraping for Journalists: How to grab data from hundreds of sources, put it in a form you can interrogate – and still hit deadlines is now live.

You can buy it from Leanpub here. Leanpub allows you to publish in installments, so you get an alert every time new content is added and update your version. This means I can adapt and improve the book based on feedback from the people who use it. In other words, it’s agile publishing, which makes for a better book. (Also, I can publish at a Codecademy-like weekly pace which suits learning particularly well.)

There’s a Facebook page and a support blog for the book for commenting too.

Meanwhile, here’s a presentation I did at News:Rewired last week which covers some of the ground from the book:

Quick and Dirty Recipe: Merging (Concatenating) Multiple CSV files (ODA Spending)

There’s been a flurry of tweets over the last few days about LOCOG’s exemption from FOI (example LOCOG response to an FOI request), but the Olympic Delivery Authority (ODA, one of the owner stakeholders) is rather more open, and publishes its spends over £25k: ODA Finance: Transparency Reports.

CSV files containing spend on a monthly basis are available from the site, using a consistent CSV file format each time (I think…). For what it’s worth, I thought it might be worth sharing a pragmatic, though not ideal, Mac/Linux/unixtools commandline recipe for generating a single file containing all this data.

  1. Right-click and download each of the CSV files on the page to the same directory (eg odaSpending) on your local machine. (There are easier ways of doing this – I tried wget on the command line, but got an Access Denied response (workaround anyone?); there are probably more than a few browser extensions/plugins that will also download all the files linked to from a page. If so, you just want to grab the csv files; if you get them all, from the command line, just copy the csv files to a new directory: eg mkdir csvfiles;cp *.csv csvfiles)
  2. On the commandline, change directory to the files directory – eg cd odaSpending/csvfiles; then join all the files together: files=*; cat $files > odaspending.csv
  3. You should now have a big file, odaspending.csv, containing all the data, although it will also contain multiple header rows (each csv file had its own header row). Open the file in a text editor (I use TextWrangler), copy from the start of the first line to the start of the second (ie copy the header row, including the end of line/carriage return), then do a Find on the header and global Replace with nothing replacing the search string. Then, depending where you started the replace, maybe paste the header (if required) back into the first row

To turn the data file into something you can explore more interactively, upload it to something like Google Fusion Tables, as I did here (data to May 2012): ODA Spending in Google Fusion Tables

Note that this recipe is a pragmatic one. Unix gurus would surely be able to work out far more efficient scripts that concatenate the files after stripping out the header in all but the first file, for example, or that maybe even check the columns are the same etc etc. But if you want something quick and dirty, this is one way of doing it… (Please feel free to add alternative recipes for achieving the same thing in the comments…)

PS here’s an example of one sort of report you can then create in Fusion Tables – ODA spend with G4S; here’s another: Seconded staff

My first ebook: Scraping For Journalists (and programming too)

Next week I will start publishing my first ebook: Scraping for Journalists.

Although I’ve written about scraping before on the blog, this book is designed to take the reader step by step through a series of tasks (a chapter each) which build a gradual understanding of the principles and techniques for tackling scraping problems. Everything has a direct application for journalism, and each principle is related to their application in scraping for newsgathering.

For example: the first scraper requires no programming knowledge, and is working within 5 minutes of reading.

I’m using Leanpub for this ebook, because it allows you to publish in installments and update the book for users – which suits a book like this perfectly, as I’ll be publishing chapters week by week, Codecademy-style.

If you want to be alerted when the book is ready register on the book’s Leanpub page.

Interest Differencing: Folk Commonly Followed by Tweeting MPs of Different Parties

Earlier this year I doodled a recipe for comparing the folk commonly followed by users of a couple of BBC programme hashtags (Social Media Interest Maps of Newsnight and BBCQT Twitterers). Prompted in part by a tweet from Michael Smethurst/@fantasticlife about generating an ESP map for UK politicians (something I’ve also doodled before – Sketching the Structure of the UK Political Media Twittersphere) I drew on the @tweetminster Twitter lists of MPs by party to generate lists of folk commonly followed by the MPs of each party.

Using the R wordcloud library commonality and comparison clouds, we can get a visual impression of folk commonly followed in significant numbers by all the MPs of the three main parties, as well as the folk the MPs of each party follow significantly and differentially to the other parties:

There’s still a fair bit to do making the methodology robust (for example, being able to cope with comparing folk commonly followed by different sets of users where the size of the set differs to a significant extent (for example, there is a large difference between the number of tweeting Conservative and LibDem MPs). I’ve also noticed that repeatedly running the comparison.cloud code turns up different clouds, so there’s some element of randomness in there. I guess this just adds to the “sketchy” nature of the visualisation; or maybe hints at a technique akin to the way a photogrpaher will take multiple shots of a subject before picking one or two to illustrate something in particular. Which is to say: the “truthiness” of the image reflects the message that you are trying to communicate. The visualisation in this case exposes a partial truth (which is to say, no absolute truth), or particular perspective about the way different groups differentially follow folk on Twitter. A couple of other quirks I’ve noticed about the comparison.cloud as currently defined: firstly, very highly represented friends are sized too large to appear in the cloud (which is why very commonly followed folk across all sets – the people that appear in the commonality cloud – tend not to appear) – there must be a better way of handling this? Secondly, if one person is represented so highly in one group that they don’t appear in the cloud for that group, they may appear elsewhere in the cloud. (So for example, I tried plotting clouds for folk commonly followed by a sample of the followers of @davegorman, as well as the people commonly followed by the friends of @davegorman – and @davegorman appeared as a small label in the friends part of the comparison.cloud (notwithstanding the fact that all the followers of @davegorman follow @davegorman, but not all his friends do… What might make more sense would be to suppress the display of a label in the colour of a particular group if that label has a higher representation in any of the other groups (and isn’t displayed because it would be too large)).

That said, as a quick sketch, I think there’s some information being revealed there (the coloured comparison.cloud seems to pull out some names that make sense as commonly followed folk peculiar to each party…). I guess way forward is to start picking apart the comparison.cloud code, another is to explore a few more comparison sets? Suggestions welcome as to what they might be…:-)

PS by the by, I notice via the Guardian datablog (Church vs beer: using Twitter to map regional differences in US culture) another Twitter based comparison project – Church or Beer? Americans on Twitter – which looked at geo-coded Tweets over a particular time period on a US state-wide basis and counted the relative occurrence of Tweets mentioning “church” or “beer”…

Let’s explode the myth that data journalism is ‘resource intensive’

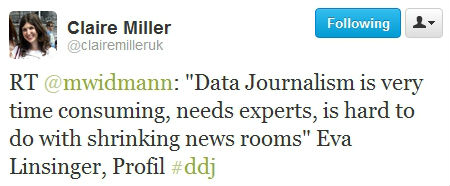
"Data Journalism is very time consuming, needs experts, is hard to do with shrinking news rooms" Eva Linsinger, Profil

Is data journalism ‘time consuming’ or ‘resource intensive’? The excuse – and I think it is an excuse – seems to come up at an increasing number of events whenever data journalism is discussed. “It’s OK for the New York Times/Guardian/BBC,” goes the argument. “But how can our small team justify the resources – especially in a time of cutbacks?

The idea that data journalism inherently requires extra resources is flawed – but understandable. Spectacular interactives, large scale datasets and investigative projects are the headliners of data journalism’s recent history. We have oohed and aahed over what has been achieved by programmer-journalists and data sleuths…

But that’s not all there is.

Continue reading