Monthly Archives: November 2016

How the BBC England data unit scraped airport noise complaints

heathrow-noise-story

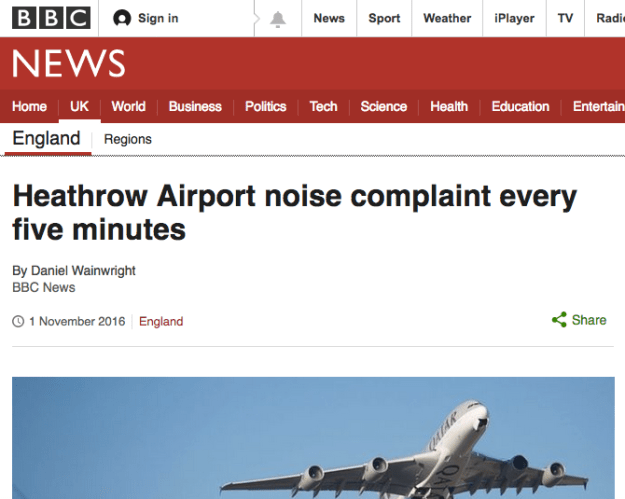
This news story used scraping to gather data on noise complaints

BBC England Data Unit’s Daniel Wainwright tried to explain basic web scraping at this year’s Data Journalism Conference but technical problems got in the way. This is what should have happened:

I’d wondered for a while why no-one who had talked about scraping at conferences had actually demonstrated the procedure. It seemed to me to be one of the most sought-after skills for any investigative journalist.

Then I tried to do so myself in an impromptu session at the first Data Journalism Conference in Birmingham (#DJUK16) and found out why: it’s not as easy as it’s supposed to look.

To anyone new to data journalism, a scraper is as close to magic as you get with a spreadsheet and no wand. Continue reading

Telegram launches chat-optimised format – and an anonymous CMS

Chat app Telegram was ahead of the curve on bots – has it just kicked off another race to create chat-optimised publishing formats?

Instant View, launched overnight, is Telegram’s answer to Facebook’s Instant Articles (added to Messenger in July), Google’s AMP and Apple News: a way for publishers to make sure content loads quickly.

For now it’s only being used by publications using Medium, and TechCrunch, but the announcement promises:

“Eventually we want to provide Instant View pages for every story on the Web”

If you’ve watched the shifts in user behaviour from web to social, and then from social to chat, you can see what might be coming next: another battle to optimise for where the eyeballs are.

telegram-instant-view-optimised-for-chat

This is what an Instant View article looks like within the Telegram app

…And an anonymous publishing platform

As well as announcing its new article format Telegram has launched an anonymous publishing CMS: Telegra.ph.

One of Telegram’s major selling points is its security and Telegra.ph is a perfect extension to that.

I’ve used the new CMS to write more about how it works.

Too many election tweets? Some simple Tweetdeck techniques for filtering the information overload

election2016-hashtags

Tonight many journalists will have Tweetdeck or similar social media dashboards ‘tuned in’ to coverage of the US election, typically by creating columns to monitor activity on key hashtags like #Election2016. But on a big occasion like this, the volume of tweets becomes unmanageable. Here then are a few quick techniques to surface tweets that are likely to be most useful to reporters:

Picking the right hashtags: Hashtagify

Hashtagify is a tool for finding out the popularity of certain hashtags. Type a tag into the search box and you’ll get a network diagram like the one shown above — but you can also switch to ‘Table mode’ to get a list of tags that you can sort by popularity, correlation, weekly or monthly trend. Continue reading

When chatbots talk about politics: 3 effective approaches

Since the trend is to use Whatsapp or Facebook Messenger rather than downloading new apps, the media is investing in chatbots to engage with the audience. They keep users awake and speak the same language.

There have been several examples of chatbots for cooking, shopping or travelling. However, politics chatbots are quite new. In a post first published on her blog, Maria Crosas Batista shares three effective approaches when it comes to cover elections or represent politicians:

1. GloBot · Canada

output_zsa6gg

Canadian newspaper The Globe and Mail has built a Facebook Messenger chatbot for the American elections that shares text, audio, and video from their website. Continue reading

Vine is gone. Here are 5 great ways it was used for datavis

After Vine’s announcement to discontinue the mobile app in the coming months, Maria Crosas Batista pulled together 5 good stories on data visualisation (first published on her site Dinfografia).

1.Legal vs illegal weapons in the US

2. The evolution of global warming

Continue reading

5 data visualisation tips from Andy Kirk and Cole Nussbaumer Knaflic

Data visualisation experts Andy Kirk and Cole Nussbaumer Knaflic – judges in this year’s Kantar Information is Beautiful Awards 2016 – have given OJB 5 tips to help those who want to sharpen up their own data science skills. Here they are:

1. Trust is paramount

gapminder

Andy Kirk: Trust is hard to earn but easy to lose so ensuring your work is trustworthy is of paramount importance. Truthfulness and accuracy should be an obligation. Continue reading

Those Android Trump tweets: David Robinson on using text data to get an election scoop

Washington Post story tweet

Data scientist David Robinson was behind one of the most striking data stories of this US election season, when his analysis of Donald Trump tweets appeared to confirm that Trump was posting the angriest comments on that account (jointly managed by his campaign staff). Barbara Maseda spoke to Robinson about the story behind that text analysis and what comes next. 

It was August 9 when David Robinson published his analysis of Trump tweets on his blog. Robinson had used a series of libraries in the programming language R to collect, clean, process and visualise the data. The process took just 12 hours, from Saturday night through Tuesday morning.

In the following days, the piece would be re-posted and cited by multiple websites, including The Washington Post and Mashable. The original piece alone had hundreds of thousands of views in just a few days.

The result wasn’t just one election story, but one of the biggest indications yet of the potential of text analysis for journalists, with three takeaways in particular: Continue reading