Monthly Archives: June 2010

Video: Guardian's Beat Blogger for Cardiff: breaking the boundaries between blogger and journalist

It’s an modern day battle: journalist versus blogger. Often operating in the same field, but with very different aims and objectives, some traditional reporters are wary of this new breed of content creator. However, a new Beat-Blogger role, created by The Guardian, has brought the 2 fields closer together.

Having a local blogger based in several cities around the UK, The Guardian has given itself direct contact with the community, something a national paper would often overlook.

Hannah Waldram is the beat-blogger in Cardiff. At News:Rewired she told OJB more about how the new project is going, and how it has been accepted in the city.

[youtube:http://www.youtube.com/watch?v=FEAaLCcjsbk%5D

Video: Vikki Chowney & Tony Curzon-Price on creating a buzz: how to get your content noticed

With so much news content available online and a host of ways to promote and share that material it’s often hard for journalists and bloggers to know how to make their content stand out. There are a host of companies offering a quick fix to this problem with promises of Facebook friends and sky-high traffic stats. However, some of the most successful blogs go for a niche audience who care about the subject matter, and spread the word organically.

OJB grabbed a few minutes at News:Rewired with Vikki Chowney (Reputation Online), and Tony Curzon-Price (openDemocracy) to find out how they make an impact online

[youtube:http://www.youtube.com/watch?v=3VuF23TDBDI%5D [youtube:http://www.youtube.com/watch?v=Dm4Tl6Fnp1w%5D

Video: BBC at the 2012 Olympics: visualisations, maps and augmented reality

With 2 years to go to the 2012 Olympics, the BBC are already starting to plan their online coverage of the event. With a large, creative team at hand who have experimented with maps, visualisations and interactive content in the past, the pressure is on them to keep the standards high.

At the recent News:Rewired event, OJB caught up with Olympics Reporter Ollie Williams, himself a visualisation guru, to find out exactly what they were planning for 2012.

[youtube:http://www.youtube.com/watch?v=XP0cUtOrvkE%5D

So Where Do the Numbers in Government Reports Come From?

Last week, the COI (Central Office of Information) released a report on the “websites run by ministerial and non-ministerial government departments”, detailing visitor numbers, costs, satisfaction levels and so on, in accordance with COI standards on guidance on website reporting (Reporting on progress: Central Government websites 2009-10).

As well as the print/PDF summary report (Reporting on progress: Central Government websites 2009-10 (Summary) [PDF, 33 pages, 942KB]) , a dataset was also released as a CSV document (Reporting on progress: Central Government websites 2009-10 (Data) [CSV, 66KB]).

The summary report is full of summary tables on particular topics, for example:

TABLE 1: REPORTED TOTAL COSTS OF DEPARTMENT-RUN WEBSITES
COI web report 2009-10 table 1

TABLE 2: REPORTED WEBSITE COSTS BY AREA OF SPENDING
COI web report 2009-10 table 2

TABLE 3: USAGE OF DEPARTMENT-RUN WEBSITES
COI website report 2009-10 table 3

Whilst I firmly believe it is a Good Thing that the COI published the data alongside the report, there is a still a disconnect between the two. The report is publishing fragments of the released dataset as information in the form of tables relating to particular reporting categories – reported website costs, or usage, for example – but there is no direct link back to the CSV data table.

Looking at the CSV data, we see a range of columns relating to costs, such as:
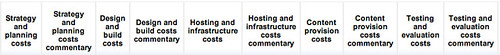
COI website report - costs column headings

and:

COI website report costs

There are also columns headed SEO/SIO, and HEO, for example, that may or may not relate to costs? (To see all the headings, see the CSV doc on Google spreadsheets).

But how does the released data relate to the summary reported data? It seems to me that there is a huge “hence” between the released CSV data and the summary report. Relating the two appears to be left as an exercise for the reader (or maybe for the data journalist looking to hold the report writers to account?).

The recently published New Public Sector Transparency Board and Public Data Transparency Principles, albeit in draft form, has little to say on this matter either. The principles appear to be focussed on the way in which the data is released, in a context free way, (where by “context” I mean any of the uses to which government may be putting the data).

For data to be useful as an exercise in transparency, it seems to me that when government releases reports, or when government, NGOs, lobbiests or the media make claims using summary figures based on, or derived from, government data, the transparency arises from an audit trail that allows us to see where those numbers came from.

So for example, around the COI website report, the Guardian reported that “[t]he report showed uktradeinvest.gov.uk cost £11.78 per visit, while businesslink.gov.uk cost £2.15.” (Up to 75% of government websites face closure). But how was that number arrived at?

The publication of data means that report writers should be able to link to views over original government data sets that show their working. The publication of data allows summary claims to be justified, and contributes to transparency by allowing others to see the means by which those claims were arrived at and the assumptions that went in to making the summary claim in the first place. (By summary claim, I mean things like “non-staff costs were X”, or the “cost per visit was Y”.)

[Just an aside on summary claims made by, or “discovered” by, the media. Transparency in terms of being able to justify the calculation from raw data is important because people often use the fact that a number was reported in the media as evidence that the number is in some sense meaningful and legitimately derived. (“According to the Guardian/Times/Telegraph/FT, etc etc etc”. To a certain extent, data journalists need to behave like academic researchers in being able to justify their claims to others.]

In Using CSV Docs As a Database, I show how by putting the CSV data into a Google spreadsheet, we can generate several different views over the data using the using the Google Query language. For example, here’s a summary of the satisfaction levels, and here’s one over some of the costs:

COI website report - costs
select A,B,EL,EN,EP,ER,ET

We can even have a go at summing the costs:

COI summed website costs
select A,B,EL+EN+EP+ER+ET

In short, it seems to me that releasing the data as data is a good start, but the promise for transparency lays in being able to share queries over data sets that make clear the origins of data-derived information that we are provided with, such as the total non-staff costs of website development, or the average cost per visit to the blah, blah website.

So what would I like to see? Well, for each of the tables in the COI website report, a link to a query over the co-released CSV dataset that generates the summary table “live” from the original dataset would be a start… 😉

PS In the meantime, to the extent that journalists and the media hold government to account, is there maybe a need for data journalysts (journalist+analyst portmanteau) to recreate the queries used to generate summary tables in government reports to find out exactly how they were derived from released data sets? Finding queries over the COI dataset that generate the tables published in the summary report is left as an exercise for the reader… 😉 If you manage to generate queries, in a bookmarkable form (e.g. using the COI website data explorer (see also this for more hints), please feel free to share the links in the comments below 🙂

Video interview: The Times: safeguarding journalism?

Currently running as a registration service, The Times plan to launch their paid-for site in the next few weeks. So far they are reluctant to release initial registration figures and the demographic audience they are attracting. OJB caught up with Assistant Editor and Head of Online Tom Whitwell at News:Rewired to find out more:

[youtube:http://www.youtube.com/watch?v=fCWt1b14yx8%5D

Guardian Datastore MPs’ Expenses Spreadsheet as a Database

Continuing my exploration of what is and isn’t acceptable around the edges of doing stuff with other people’s data(?!), the Guardian datastore have just published a Google spreadsheet containing partial details of MPs’ expenses data over the period July-Decoember 2009 (MPs’ expenses: every claim from July to December 2009):

thanks to the work of Guardian developer Daniel Vydra and his team, we’ve managed to scrape the entire lot out of the Commons website for you as a downloadable spreadsheet. You cannot get this anywhere else.

In sharing the data, the Guardian folks have opted to share the spreadsheet via a link that includes an authorisation token. Which means that if you try to view the spreadsheet just using the spreadsheet key, you won’t be allowed to see it; (you also need to be logged in to a Google account to view the data, both as a spreadsheet, and in order to interrogate it via the visualisation API). Which is to say, the Guardian datastore folks are taking what steps they can to make the data public, whilst retaining some control over it (because they have invested resource in collecting the data in the form they’re re-presenting it, and reasonably want to make a return from it…)

But in sharing the link that includes the token on a public website, we can see the key – and hence use it to access the data in the spreadsheet, and do more with it… which may be seen as providing a volume add service over the data, or unreasonably freeloading off the back of the Guardian’s data scraping efforts…

So, just pasting the spreadsheet key and authorisation token into the cut down Guardian datastore explorer script I used in Using CSV Docs As a Database to generate an explorer for the expenses data.

So for example, we can run for example run a report to group expenses by category and MP:

MP expesnes explorer

Or how about claims over 5000 pounds (also viewing the information as an HTML table, for example).

Remember, on the datastore explorer page, you can click on column headings to order the data according to that column.

Here’s another example – selecting A,sum(E), where E>0 group by A and order is by sum(E) then asc and viewing as a column chart:

Datastore exploration

We can also (now!) limit the number of results returned, e.g. to show the 10 MPs with lowest claims to date (the datastore blog post explains that why the data is incomplete and to be treated warily).

Limiting results in datstore explorer

Changing the asc order to desc in the above query gives possibly a more interesting result, the MPs who have the largest claims to date (presumably because they have got round to filing their claims!;-)

Datastore exploring

Okay – enough for now; the reason I’m posting this is in part to ask the question: is the this an unfair use of the Guardian datastore data, does it detract from the work they put in that lets them claim “You cannot get this anywhere else”, and does it impact on the returns they might expect to gain?

Sbould they/could they try to assert some sort of database collection right over the collection/curation and re-presentation of the data that is otherwise publicly available that would (nominally!) prevent me from using this data? Does the publication of the data using the shared link with the authorisation token imply some sort of license with which that data is made available? E.g. by accepting the link by clicking on it, becuase it is a shared link rather than a public link, could the Datastore attach some sort of tacit click-wrap license conditions over the data that I accept when I accept the shared data by clicking through the shared link? (Does the/can the sharing come with conditions attached?)

PS It seems there was a minor “issue” with the settings of the spreadsheet, a result of recent changes to the Google sharing setup. Spreadsheets should now be fully viewable… But as I mention in a comment below, I think there are still interesting questions to be considered around the extent to which publishers of “public” data can get a return on that data?

Help Me Investigate shortlisted for Multimedia Publisher of the Year

UPDATE: Help Me Investigate finished second and was “Highly commended”. The winner was Scottish news site The Caledonian Mercury (well deserved).

My crowdsourced investigative journalism site Help Me Investigate is up for Multimedia Publisher of the Year at the NUJ’s Regional Media Awards.

Also nominated are:

The curious case of More! magazine, Twitter and the mocking retweets

Here’s the strange tale of Blair and More! magazine. Blair is a fashion blogger who picked up a copy of More! magazine, didn’t like what she saw, and tweeted it.

More! then retweeted Blair’s critical opinions to their 11,000-plus followers – along with a couple of tweets that Blair had directed at a friend. Continue reading

4 things you need to know about Google this week

1. Google encrypted search

In a move which could have enormous implications for online publishers, Google announced that it is experimenting with encrypted search.

In plainer language, this means that – if someone is using the service – you won’t know what they have been searching for when they arrive at your website. This is great for privacy, but clearly scuppers any plans publishers might have to sell advertising based on what people are searching for when they arrive at the site – or, indeed, plans to adapt editorial based on what users are most interested in. Continue reading