
At this year’s Dataharvest I delivered a workshop on using Python in QGIS to automate the process of exporting maps for multiple locations. Here’s how to do it (you can find a GitHub repository with materials and links here).
Making a map for a story is cool — but what if you could make a map for every reader? Or if you’re working on a project involving teams in different regions or countries, what if you could give each one of those teams a map centred on their own patch?
Normally you would have to manually move the map to centre it on a key city, and then export an image. Then do it again and again and again for every area.
Luckily, QGIS has the ability to run code. And this is a great excuse to start using it.
Start by creating your base map
Before getting into the code, however, you need a map for the code to move around
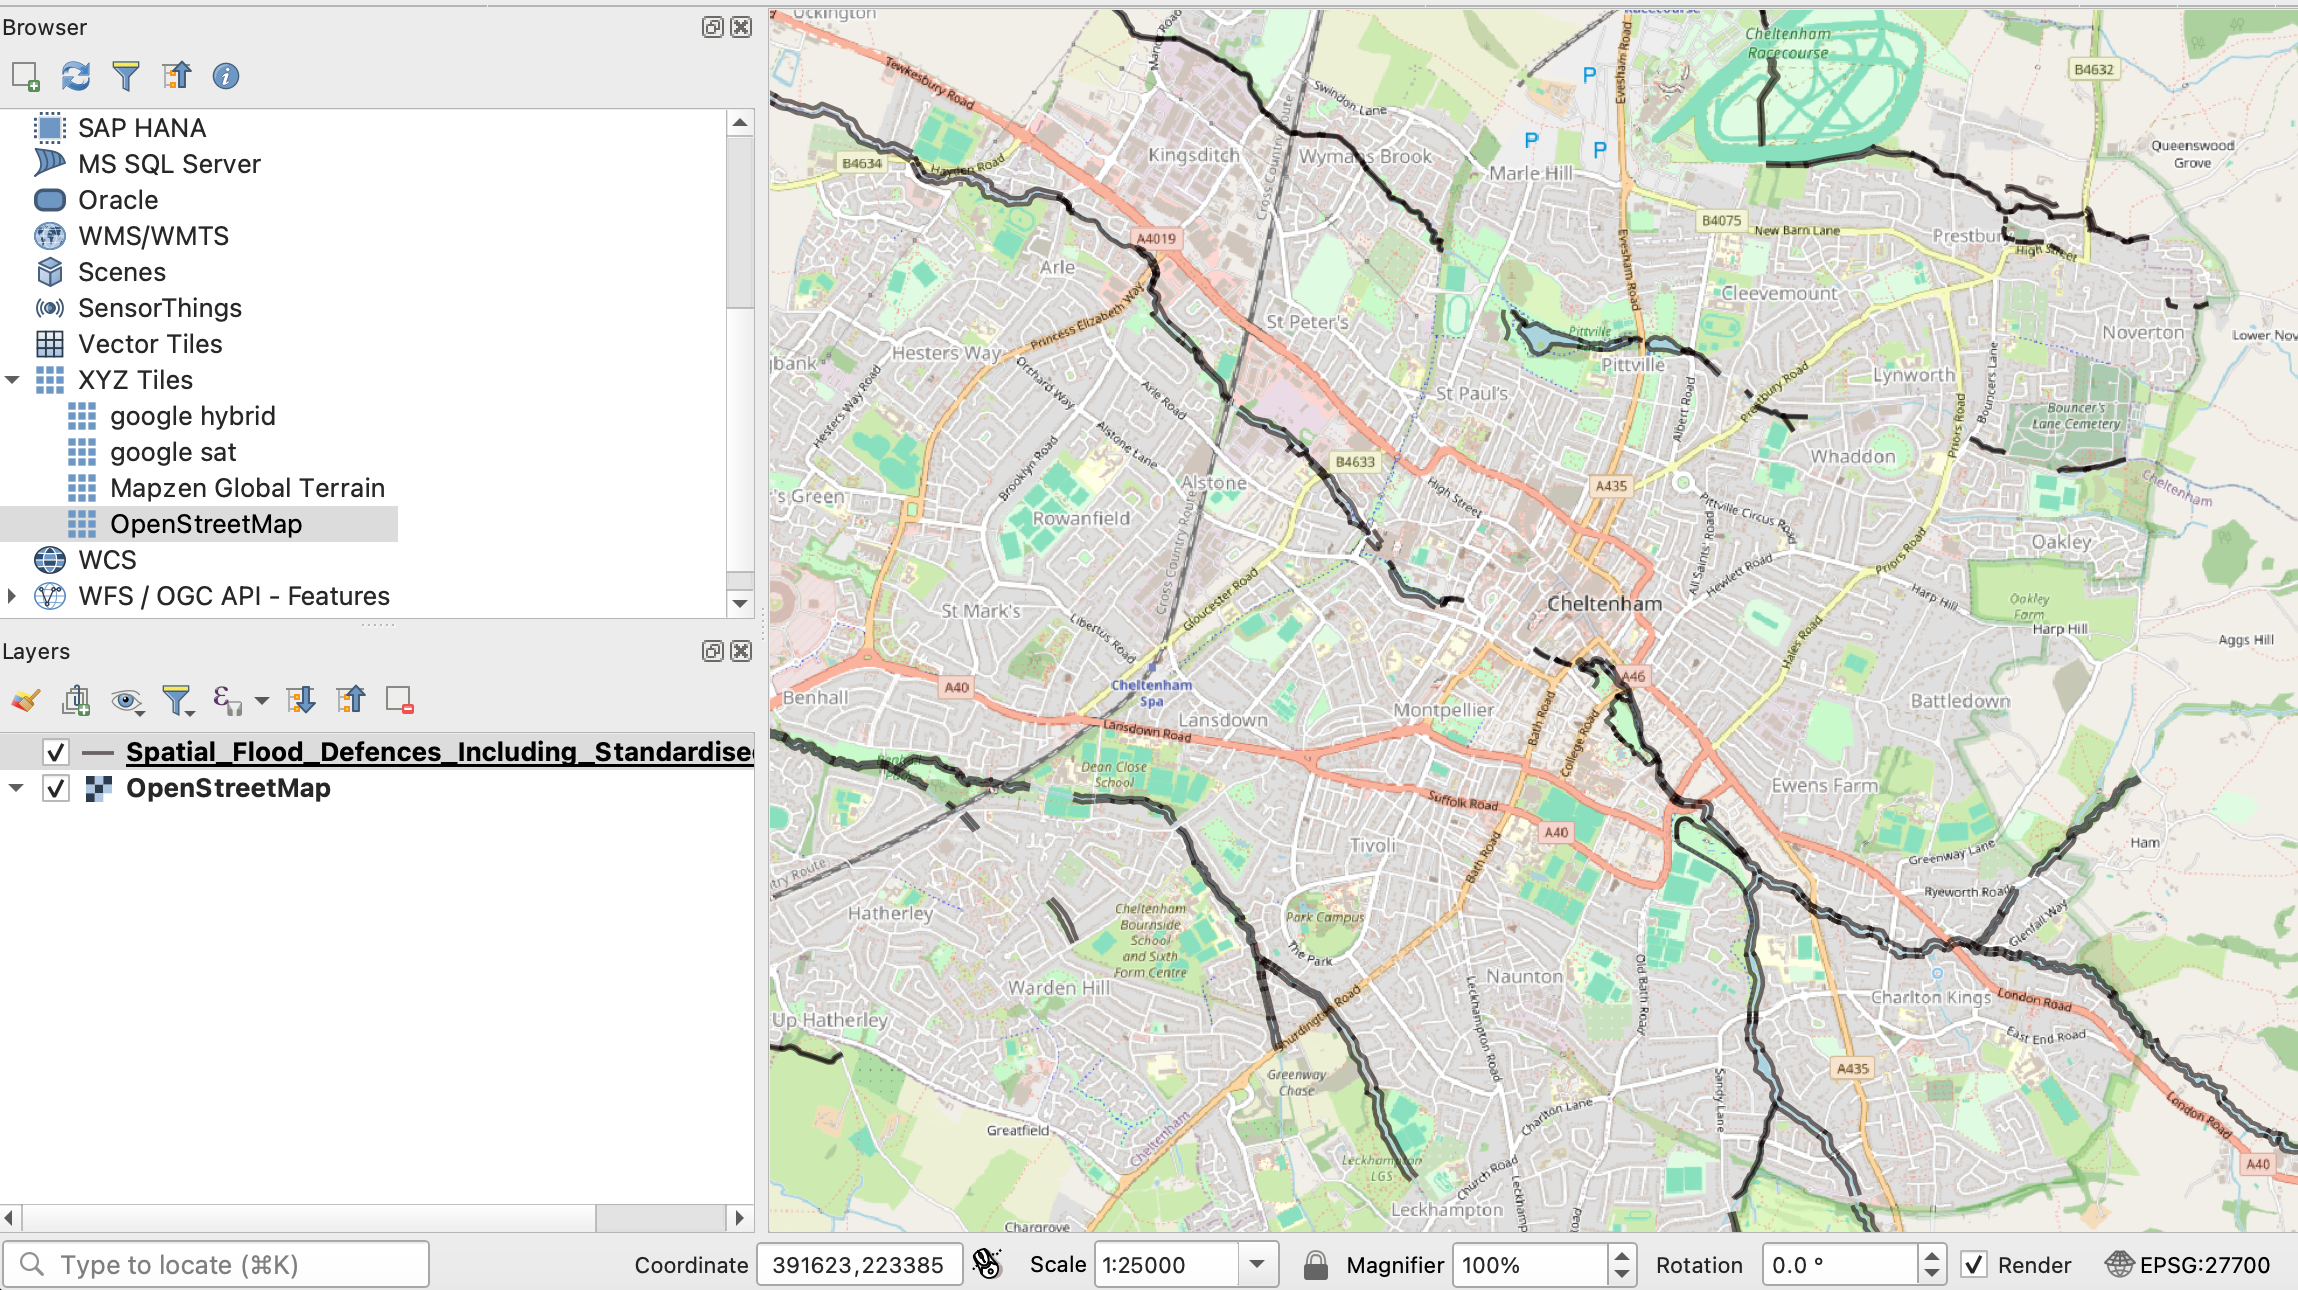
Create a new project in QGIS and import any shape file(s) that you want to show on your map, along with a base map underneath that. I’ve created a tutorial here which imports flood defences and then adds an OpenStreetMap base layer underneath those.
Tweak the design of the map until you’re happy, and then zoom into one of the locations on your map (for example, a key city). We need to use this to create a test ‘area map’ so we have an idea of the scale and proportions we can use when we automate things.
Once zoomed in, create an image layout by selecting Project > New Print Layout…. I’ve created a tutorial for that, too, which you can follow here. This allows you to identify what scale to use when you start to add code.
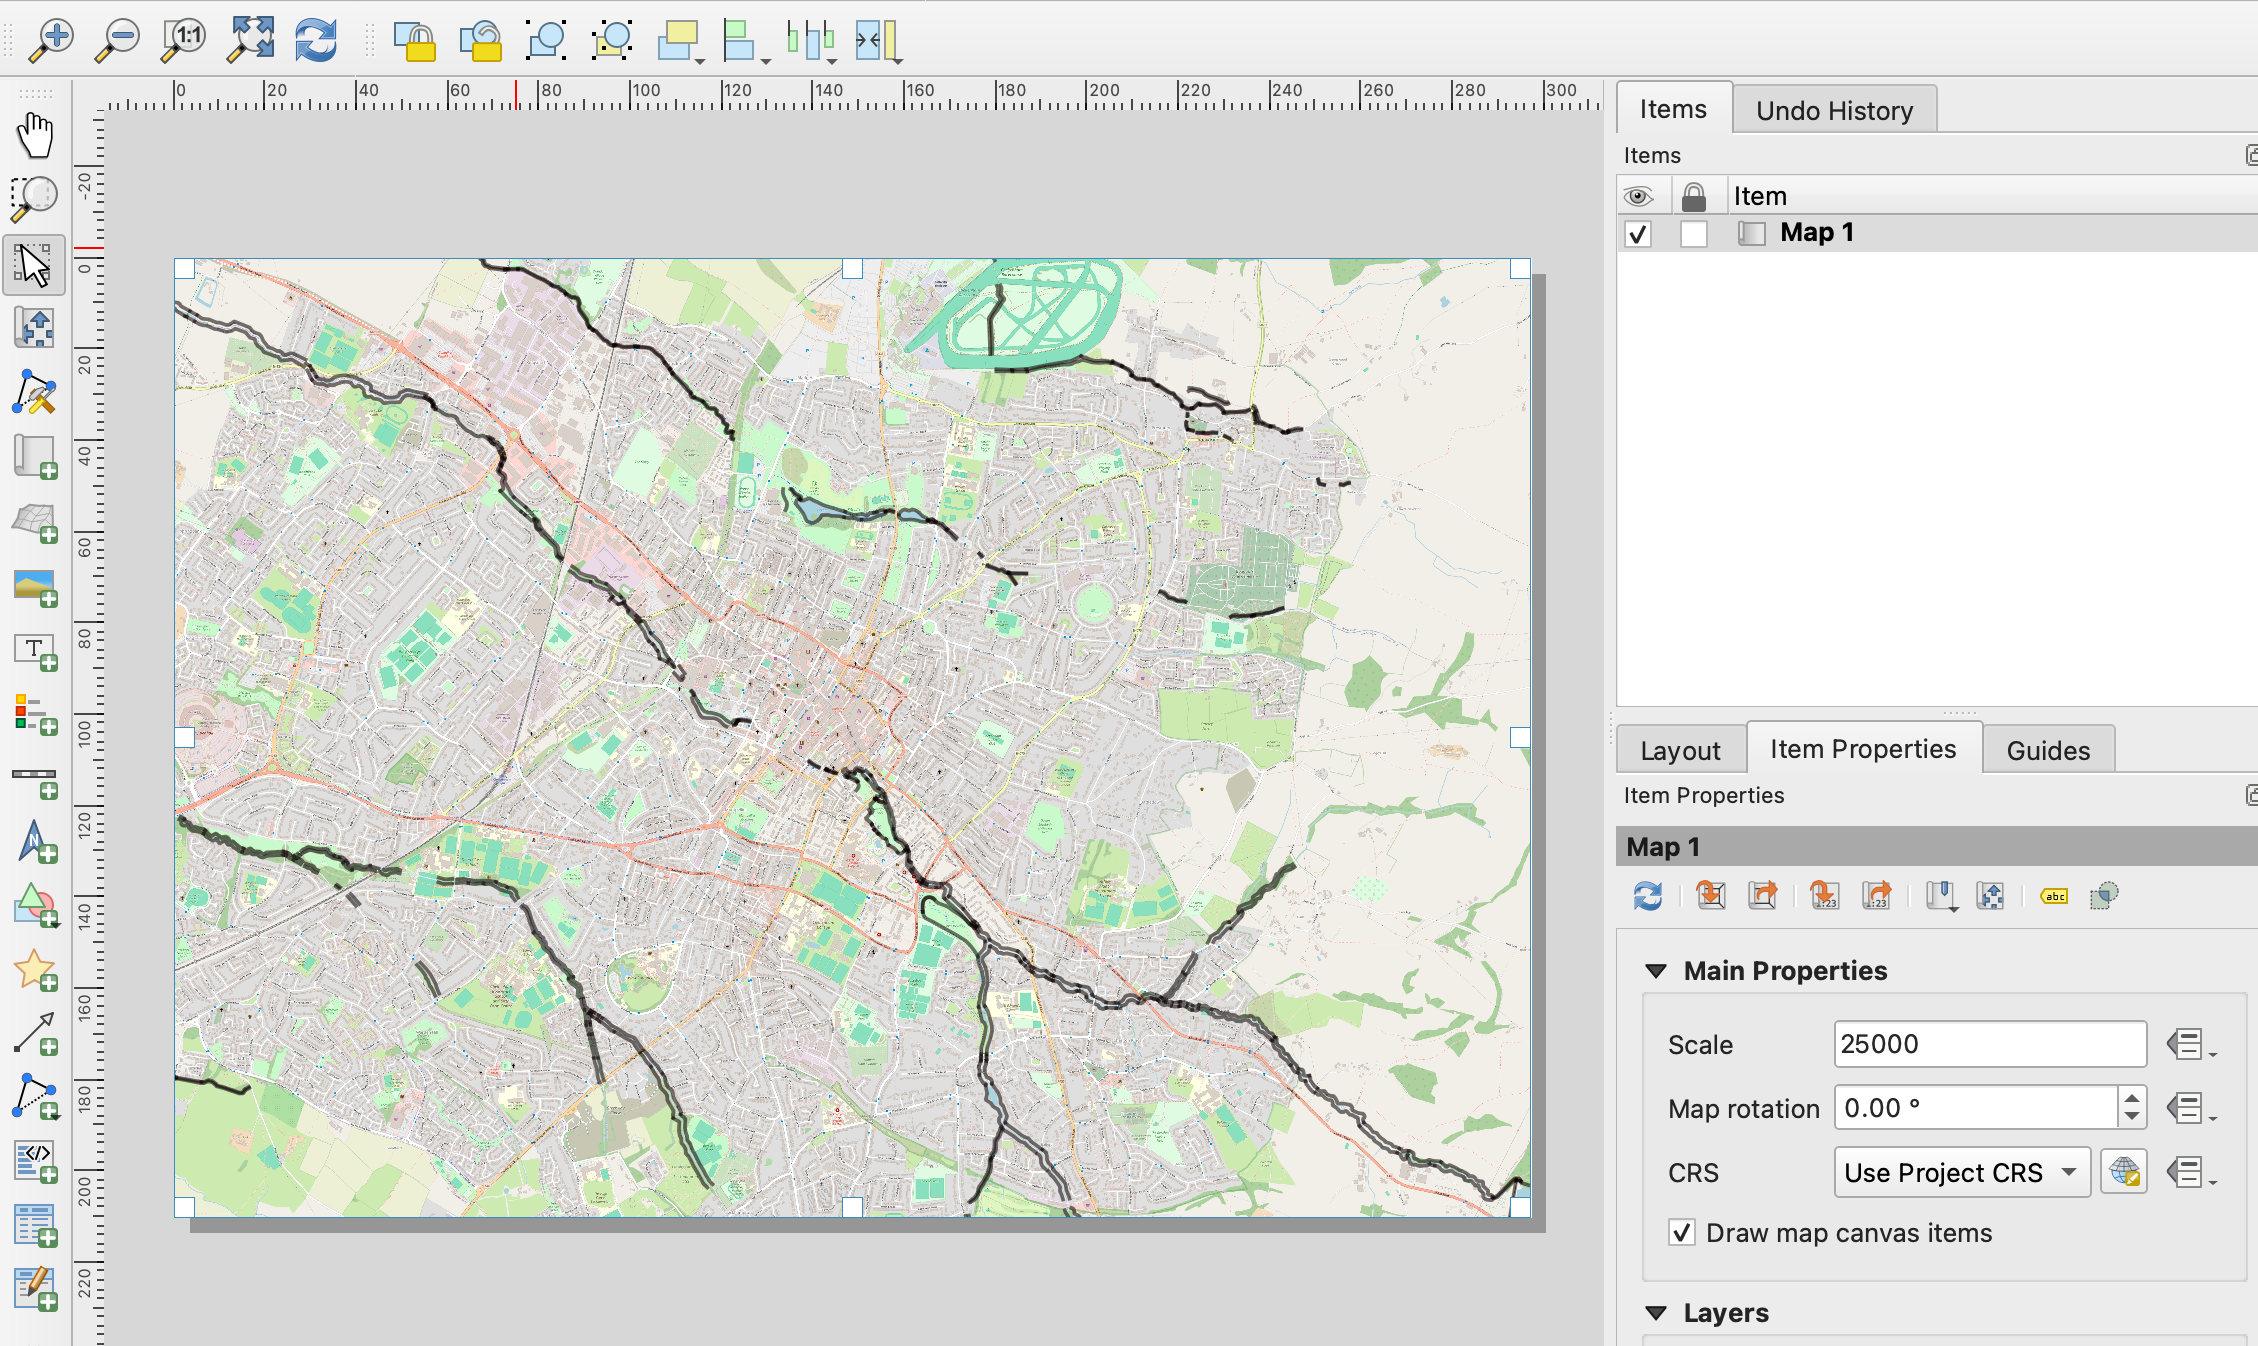
PS: you can make the map entirely in code itself without doing any of this, but I find it quicker to work with the map on screen first so the results can be checked and tweaked more quickly.
Download the template Python script and open in QGIS
I’ve written a Python script that you can import into QGIS to generate multiple images from our map. You can see the code here. To download it, click the three dots in the upper right corner and select Download. I’ve created a tutorial here which walks through the steps.
The code does the following:
- Specifies a folder to store all the images
- Stores a list of lat-longs
- Creates a transformer to convert those to the projection used by your shape files (the coordinate reference system, or CRS)
- Sets a map size and scale
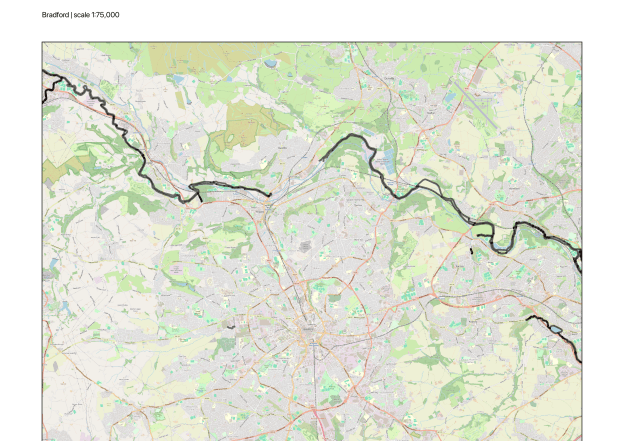
- Loops through each location in the list, zooms to that scale, and adds a label with the location and scale
- Sets a filename that includes the name of the location
- Exports an image with that name (for each location in the list)
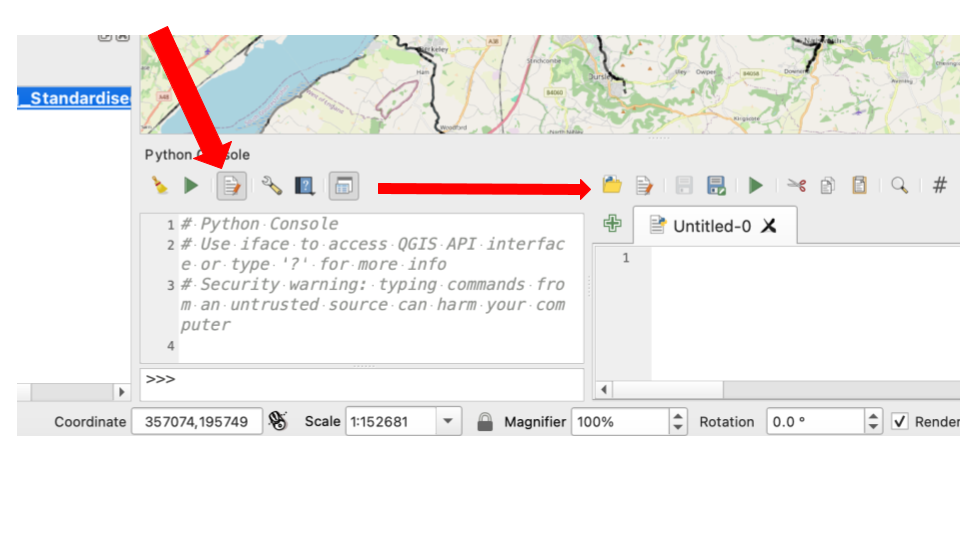
Download it to the same folder as your QGIS project and open it in QGIS by going to Plugins > Python console as outlined in the tutorial.
Run the script — and customise it
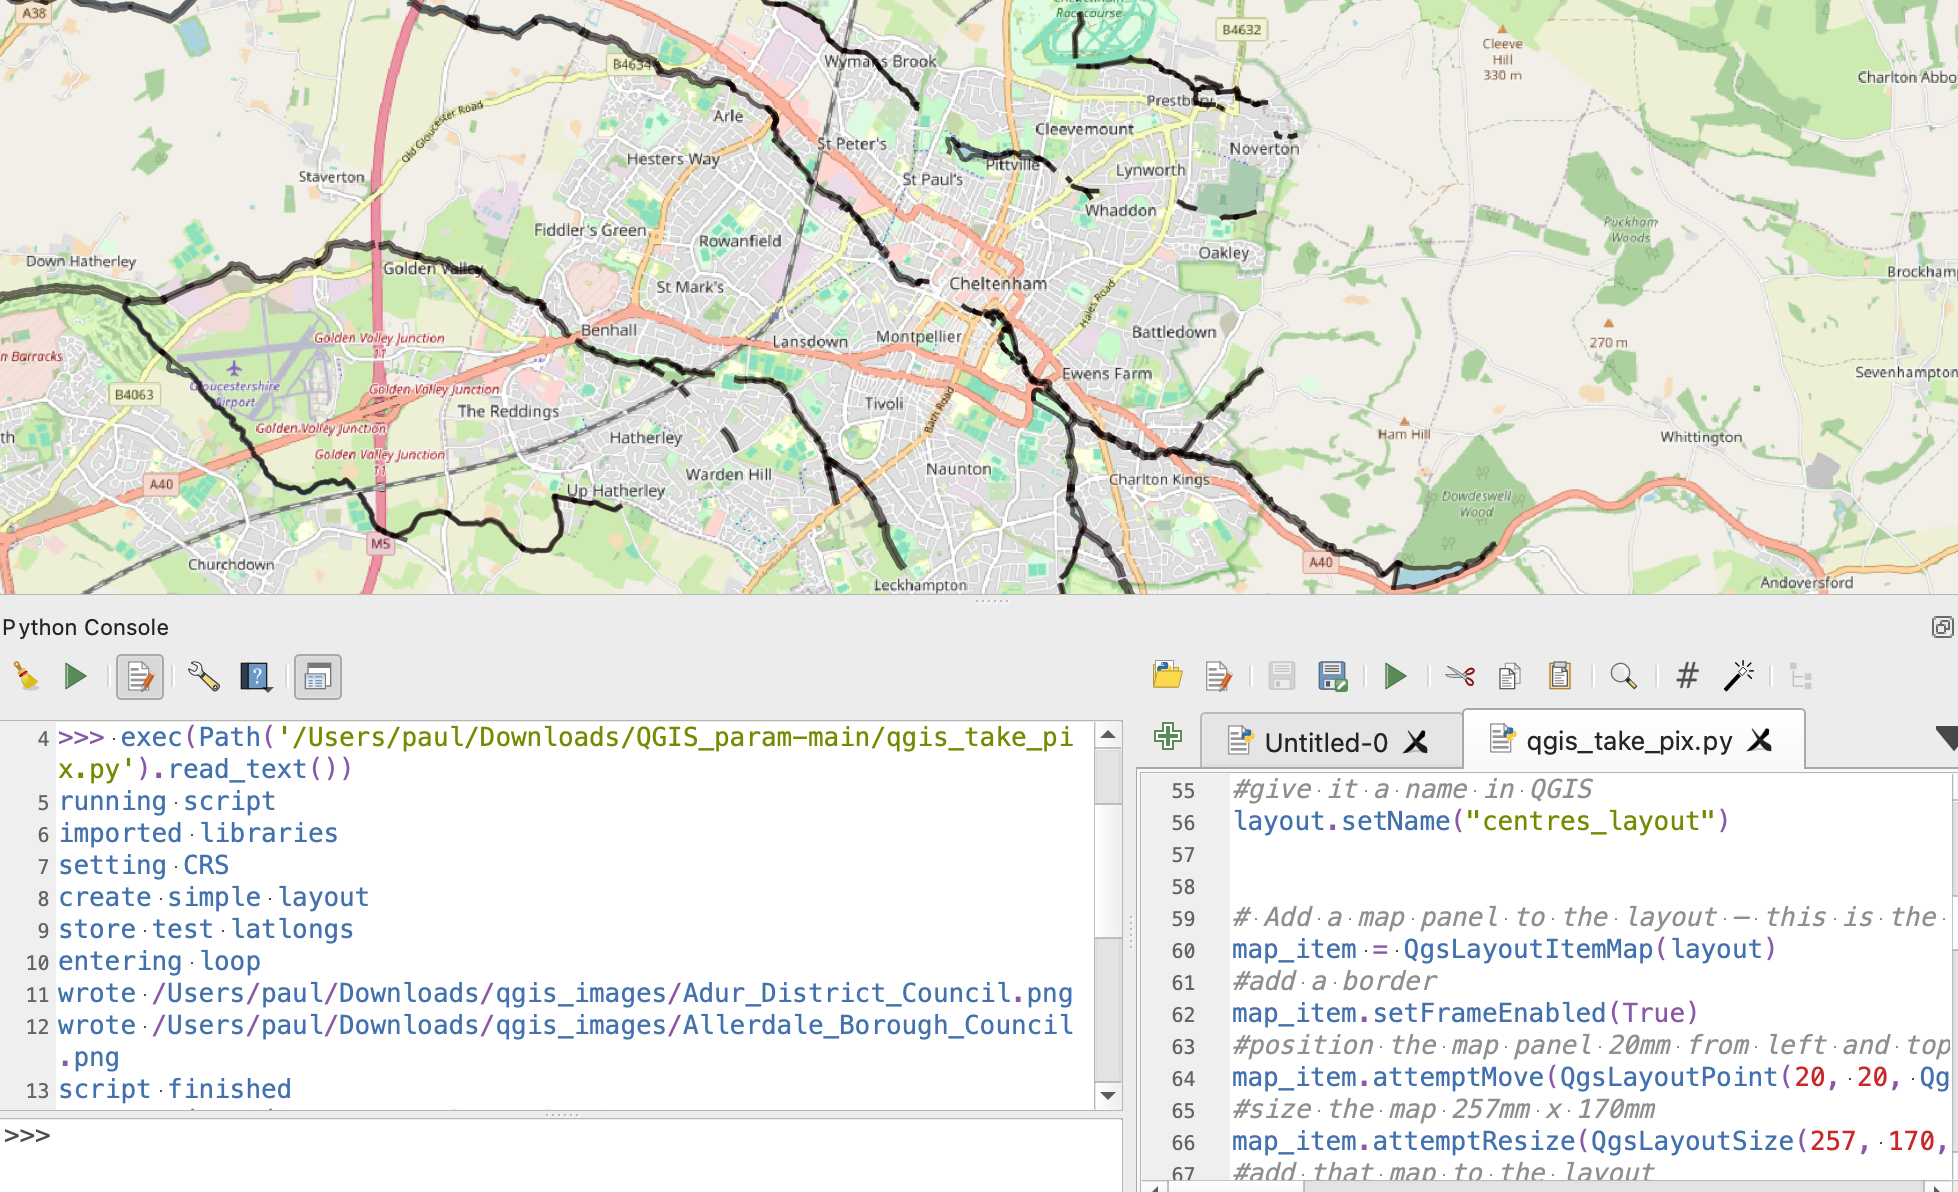
Once you’ve downloaded the script and opened it in QGIS, you can check if it works.
Click the green ‘Run’ button to run the script. As it runs the Console area on the left of the Python Console will display any print messages that are in the script to make it easier to track where the script is (like running script and imported libraries).
The two key things to keep an eye on are whether it exports to the right location, and whether the list of locations works.
The code includes a line which sets a target directory on your computer:
out_dir = os.path.join(os.path.expanduser("~"), "Downloads", "qgis_images")
If it works, you should find the images in your Downloads folder, in a folder called qgis_images.
But it might not work on your computer. If it doesn’t – if you get an error – or if you just want to store the images somewhere else, you can do that by uncommenting the following line of code (i.e. removing the hash character) and changing it to describe a path on your computer:
# out_prefix = "/Users/paul/Downloads/testqgis/images/"
You can edit the code directly in the editor window in QGIS (the part of the Python Console where you can see the code) – make sure that you save it once you’ve made any changes.
The list of locations is in this block of code:
listofdicstocsv = [ {'lat': 50.844441271809465, 'long': -0.2985307978506628, 'officialname': 'Adur District Council'}, {'lat': 54.71108952940033, 'long': -3.2472347297148736, 'officialname': 'Allerdale Borough Council'}]
This should work with the flood defences data, but if you are using a different map you will need different lat-longs and place names. You can edit these manually for now with your own test lat-longs and names if needed.
Expand the list
Once you’ve got it working with two locations, it’s time to update the code so that it uses a full list of locations. Automating a process like this is called parameterisation, because it involves generating multiple outputs based on one or more parameters (in this case the lat and long and name).
In the tutorial we are using a list of major cities in the UK. You might need a similar list for another country, or it might be centre points of different regions, or the locations of key events.
Whatever the locations are, you’ll need to convert that list into a Python list of dictionaries.
A dictionary looks like this:
{'lat': 50.844441271809465, 'long': -0.2985307978506628, 'officialname': 'Adur District Council'}
The curly brackets are the giveaway: those mark the start and end of a dictionary. Inside them is a series of pairs, which are equivalent to a label (lat, long, officialname), or key, followed by a value (50.8, -0.29, ‘Adur District Council). Each of these pairs (called key-value pairs) is separated by a comma.
A dictionary is like a row in a table: the keys are the column headings and stay the same each time, while the values are different in each row. So when you have a list of dictionaries, it’s basically a list of rows. In other words, it is just another way of storing a table.
So we are going to need a table of locations (the ones we want to create maps for). We can then convert that table to a list of dictionaries (a list of table rows).
You might be tempted to paste your table or attach a CSV in a prompt and ask an AI tool to convert that into a list of Python dictionaries. But it’s important when using AI to assess whether the task justifies the environmental impact and consider non-AI alternatives that achieve the same results.
For example, the website CSV2JSON will perform this task (JSON is just a list of dictionaries). It will take a CSV file and provide it as a list of dictionaries that you can copy and paste into your Python script. I’ve also written a tutorial on other options to achieve the same results with a spreadsheet formula.
Once you’ve got your list of dictionaries, you can replace the list in the template Python script that starts and ends with square brackets here:
[ {'lat': 50.844441271809465, 'long': -0.2985307978506628, 'officialname': 'Adur District Council'}, {'lat': 54.71108952940033, 'long': -3.2472347297148736, 'officialname': 'Allerdale Borough Council'}]
Note that the list starts and ends with square brackets, and each dictionary in that list is separated by a comma.
Once your list is pasted, you’ll probably have a big chunk of code (or a very long line of code) with all those locations.
Testing the expanded list
You can now test the code works with more locations by saving the updated code and running it again.
But you might not want to export hundreds of images straight away, as this will take a while.
Instead, you can try a slice of the list by adding square brackets when you run your loop to specify a limited range of items, like this:
for rec in listofdicstocsv[10:20]:
That [10:20] means just loop through items at positions 10 to 19 (it stops just before the 20th item) in the list listofdictstocsv. You can obviously change those numbers to specify a different range.
Once it runs fine with the range specified, you can then look at the results and decide whether you want to export all the images, or tweak your code further to a different scale — or multiple scales…
Exporting more than one scale
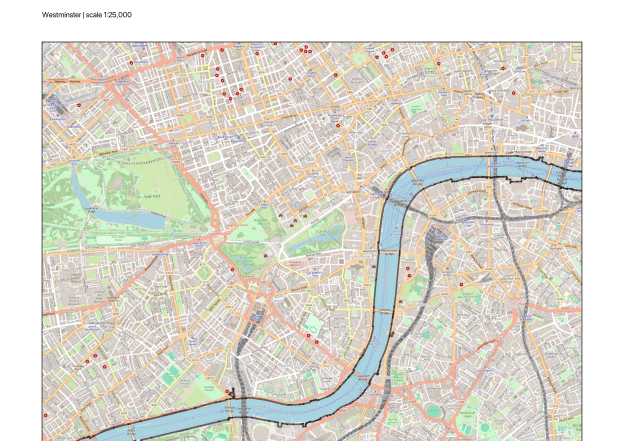
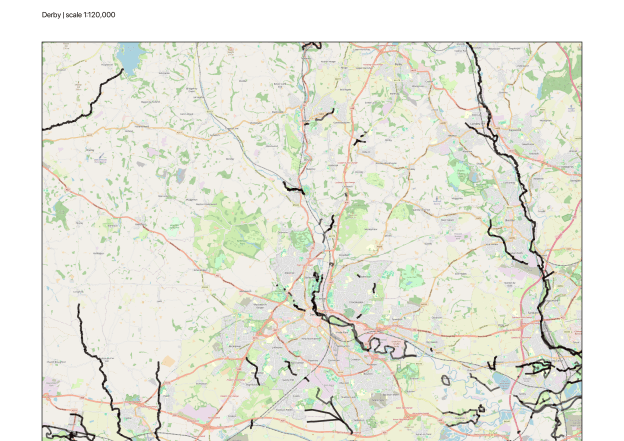
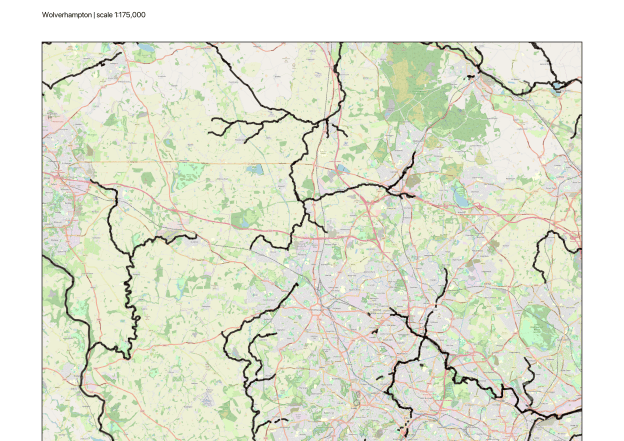
As you export multiple images you might notice that not all locations are the same. Some locations are self-contained and suit a smaller scale (e.g. more rural cities or a London borough), while others are large conurbations (e.g. Birmingham) that need a larger scale to show all the different parts.
Now we need to adapt the code to export at more than one scale.
You can see an example of this adaptation in a second Python script. This adds code that does the following:
- Creates a list of scales to use
- Adds an extra loop inside the one that loops through each location, which loops through each scale
- Zooms to that location at each scale, and exports an image for that scale (with an appropriate label and filename)
The key block of code to adapt is this one:
MAP_SCALES = [ 175000, # original scale 120000 # zoomed-in version]
You can replace those values with your own preferred scales, and it should work.
But what about other adaptations — and trouble-shooting? This might be where you turn to AI…
Using AI to adapt QGIS Python code further
Large language models (LLMs) are particularly well suited to helping with coding and coding problems — but that comes with the risk of deskilling, or denying you the opportunity to learn. To manage that risk, try a prompt design which begins with this template:
You are my mentor, a data journalist with over a decade's experience in the field. You have advanced statistical knowledge as well as a healthy scepticism when dealing with both data and human sources. I will ask you for help with some coding - you are happy to guide me, but you don't want me to become deskilled and too reliant on you. Your advice will always be designed to force me to think for myself, learn new skills and concepts, and practise those.When you provide code add comments explaining each step as if to a person with no coding experience. I prefer simple code that requires multiple lines to complex code in one or two lines.Flag any assumptions you are making about the data or my question. Warn me if the question does not contain enough information to answer accurately.Warn me if the result could be misleading without additional context.
Responses using this template are likely to help you better understand the code that is being produced, as well as identifying things to consider (such as the risks of mixing layers with different projections) and pushing back if you’re leaving important information out.
To adapt the Python code, you might then attach the script with a prompt like this:
Attached is some Python that generates images for maps centred at hundreds of locations. Adapt this so that it now generates those images at two different scales. Comment the code to highlight the section of code where it does this, so that I can tweak it and try different zoom levels.
Other ways to address deskilling include parallel prompting, journey prompts and destination-journey prompting.
You can find the slides from my Dataharvest workshop, including Spanish, Italian, Portuguese, French and Dutch versions, along with walkthroughs, materials and useful links, in this GitHub repo.
