Monthly Archives: November 2011

The strikes and the rise of the liveblog

Liveblogging the strikes: Twitter's #n30 stream

Liveblogging the strikes: Twitter's #n30 stream

Today sees the UK’s biggest strike in decades as public sector workers protest against pension reforms. Most news organisations are covering the day’s events through liveblogs: that web-native format which has so quickly become the automatic choice for covering rolling news.

To illustrate just how dominant the liveblog has become take a look at the BBCChannel 4 News, The Guardian’s ‘Strikesblog‘ or The TelegraphThe Independent’s coverage is hosted on their own live.independent.co.uk subdomain while Sky have embedded their liveblog in other articles. There’s even a separate Storify liveblog for The Guardian’s Local Government section, and on Radio 5 Live you can find an example of radio reporters liveblogging.

Regional newspapers such as the Chronicle in the north east and the Essex County Standard are liveblogging the local angle; while the Huffington Post liveblog the political face-off at Prime Minister’s Question Time and the PoliticsHome blog liveblogs both. Leeds Student are liveblogging too. And it’s not just news organisations: campaigning organisation UK Uncut have their own liveblog, as do the public sector workers union UNISON and Pensions Justice (on Tumblr).

So dominant so quickly

The format has become so dominant so quickly because it satisfies both editorial and commercial demands: liveblogs are sticky – people stick around on them much longer than on traditional articles, in the same way that they tend to leave the streams of information from Twitter or Facebook on in the background of their phone, tablet or PC – or indeed, the way that they leave on 24 hour television when there are big events.

It also allows print outlets to compete in the 24-hour environment of rolling news. The updates of the liveblog are equivalent to the ‘time-filling’ of 24-hour television, with this key difference: that updates no longer come from a handful of strategically-placed reporters, but rather (when done well) hundreds of eyewitnesses, stakeholders, experts, campaigners, reporters from other news outlets, and other participants.

The results (when done badly) can be more noise than signal – incoherent, disconnected, fragmented. When done well, however, a good liveblog can draw clarity out of confusion, chase rumours down to facts, and draw multiple threads into something resembling a canvas.

At this early stage liveblogging is still a form finding its feet. More static than broadcast, it does not require the same cycle of repetition; more dynamic than print, it does, however, demand regular summarising.

Most importantly, it takes place within a network. The audience are not sat on their couches watching a single piece of coverage; they may be clicking between a dozen different sources; they may be present at the event itself; they may have friends or family there, sending them updates from their phone. If they are hearing about something important that you’re not addressing, you have a problem.

The list of liveblogs above demonstrates this particularly well, and it doesn’t include the biggest liveblog of all: the #n30 thread on Twitter (and as Facebook users we might also be consuming a liveblog of sorts of our friends’ updates).

More than documenting

In this situation the journalist is needed less to document what is taking place, and more to build on the documentation that is already being done: by witnesses, and by other journalists. That might mean aggregating the most important updates, or providing analysis of what they mean. It might mean enriching content by adding audio, video, maps or photography. Most importantly, it may mean verifying accounts that hold particular significance.

Liveblogging: adding value to the network

Liveblogging: adding value to the network

These were the lessons that I sought to teach my class last week when I reconstructed an event in the class and asked them to liveblog it (more in a future blog post). Without any briefing, they made predictable (and planned) mistakes: they thought they were there purely to document the event.

But now, more than ever, journalists are not there solely to document.

On a day like today you do not need to be journalist to take part in the ‘liveblog’ of #n20. If you are passionate about current events, if you are curious about news, you can be out there getting experience in dealing with those events – not just reporting them, but speaking to the people involved, recording images and audio to enrich what is in front of you, creating maps and galleries and Storify threads to aggregate the most illuminating accounts. Seeking reaction and verification to the most challenging ones.

The story is already being told by hundreds of people, some better than others. It’s a chance to create good journalism, and be better at it. I hope every aspiring journalist takes it, and the next chance, and the next one.

How to deal with a PR man who emails like a lawyer

There’s a fascinating case study going on across some skeptics blogs on dealing with legal threats from another country.

The Quackometer and Rhys Morgan have – among others – received emails from Marc Stephens, who claims to “represent” the Burzynski Clinic in Houston, Texas, and threatens them with legal action for libel, among other things.

What is notable is how both have researched both Stephens and the law, and composed their responses accordingly. From Rhys Morgan:

“I have carried out some internet research, and I have not been able to establish whether or not Mr. Stephens is a lawyer; certainly he does not appear to be a member of the California Bar nor the Texas Bar in the light of my visit to the California Bar Association’s and the State Bar of Texas’s websites.”

From Quackometer:

“This foam-flecked angry rant did not look like the work of a lawyer to me. And indeed it is not. Marc Stephens appears to work for Burzynski in the form of PR, marketing and sponsorship.”

There’s plenty more in each post, including reference to case law and the pre-action defamation protocol, which provide plenty of material if you’re ever in a similar situation – or hosting a classroom discussion on libel law.

via Neurobonkers

Accessing and Visualising Sentencing Data for Local Courts

A recent provisional data release from the Ministry of Justice contains sentencing data from English(?) courts, at the offence level, for the period July 2010-June 2011: “Published for the first time every sentence handed down at each court in the country between July 2010 and June 2011, along with the age and ethnicity of each offender.” Criminal Justice Statistics in England and Wales [data]

In this post, I’ll describe a couple of ways of working with the data to produce some simple graphical summaries of the data using Google Fusion Tables and R…

…but first, a couple of observations:

– the web page subheading is “Quarterly update of statistics on criminal offences dealt with by the criminal justice system in England and Wales.”, but the sidebar includes the link to the 12 month set of sentencing data;
– the URL of the sentencing data is http://www.justice.gov.uk/downloads/publications/statistics-and-data/criminal-justice-stats/recordlevel.zip, which does not contain a time reference, although the data is time bound. What URL will be used if data for the period 7/11-6/12 is released in the same way next year?

The data is presented as a zipped CSV file, 5.4MB in the zipped form, and 134.1MB in the unzipped form.

The unzipped CSV file is too large to upload to a Google Spreadsheet or a Google Fusion Table, which are two of the tools I use for treating large CSV files as a database, so here are a couple of ways of getting in to the data using tools I have to hand…

Unix Command Line Tools

I’m on a Mac, so like Linux users I have ready access to a Console and several common unix commandline tools that are ideally suited to wrangling text files (on Windows, I suspect you need to install something like Cygwin; a search for windows unix utilities should turn up other alternatives too).

In Playing With Large (ish) CSV Files, and Using Them as a Database from the Command Line: EDINA OpenURL Logs and Postcards from a Text Processing Excursion I give a couple of examples of how to get started with some of the Unix utilities, which we can crib from in this case. So for example, after unzipping the recordlevel.csv document I can look at the first 10 rows by opening a console window, changing directory to the directory the file is in, and running the following command:

head recordlevel.csv

Or I can pull out rows that contain a reference to the Isle of Wight using something like this command:

grep -i wight recordlevel.csv > recordsContainingWight.csv

(The -i reads: “ignoring case”; grep is a command that identifies rows contain the search term (wight in this case). The > recordsContainingWight.csv says “send the result to the file recordsContainingWight.csv” )

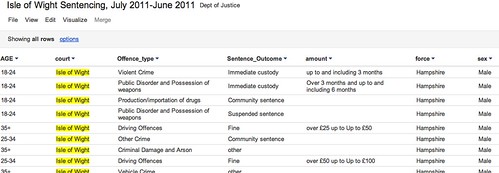
Having extracted rows that contain a reference to the Isle of Wight into a new file, I can upload this smaller file to a Google Spreadsheet, or as Google Fusion Table such as this one: Isle of Wight Sentencing Fusion table.

Isle fo wight sentencing data

Once in the fusion table, we can start to explore the data. So for example, we can aggregate the data around different values in a given column and then visualise the result (aggregate and filter options are available from the View menu; visualisation types are available from the Visualize menu):

Visualising data in google fusion tables

We can also introduce filters to allow use to explore subsets of the data. For example, here are the offences committed by females aged 35+:

Data exploration in Google FUsion tables

Looking at data from a single court may be of passing local interest, but the real data journalism is more likely to be focussed around finding mismatches between sentencing behaviour across different courts. (Hmm, unless we can get data on who passed sentences at a local level, and look to see if there are differences there?) That said, at a local level we could try to look for outliers maybe? As far as making comparisons go, we do have Court and Force columns, so it would be possible to compare Force against force and within a Force area, Court with Court?

R/RStudio

If you really want to start working the data, then R may be the way to go… I use RStudio to work with R, so it’s a simple matter to just import the whole of the reportlevel.csv dataset.

Once the data is loaded in, I can use a regular expression to pull out the subset of the data corresponding once again to sentencing on the Isle of Wight (i apply the regular expression to the contents of the court column:

recordlevel <- read.csv("~/data/recordlevel.csv")
iw=subset(recordlevel,grepl("wight",court,ignore.case=TRUE))

We can then start to produce simple statistical charts based on the data. For example, a bar plot of the sentencing numbers by age group:

age=table(iw$AGE)
barplot(age, main="IW: Sentencing by Age", xlab="Age Range")

R - bar plot

We can also start to look at combinations of factors. For example, how do offence types vary with age?

ageOffence=table(iw$AGE, iw$Offence_type)
barplot(ageOffence,beside=T,las=3,cex.names=0.5,main="Isle of Wight Sentences", xlab=NULL, legend = rownames(ageOffence))

R barplot - offences on IW

If we remove the beside=T argument, we can produce a stacked bar chart:

barplot(ageOffence,las=3,cex.names=0.5,main="Isle of Wight Sentences", xlab=NULL, legend = rownames(ageOffence))

R - stacked bar chart

If we import the ggplot2 library, we have even more flexibility over the presentation of the graph, as well as what we can do with this sort of chart type. So for example, here’s a simple plot of the number of offences per offence type:

require(ggplot2)
#You may need to install ggplot2 as a library if it isn't already installed
ggplot(iw, aes(factor(Offence_type)))+ geom_bar() + opts(axis.text.x=theme_text(angle=-90))+xlab('Offence Type')

GGPlot2 in R

Alternatively, we can break down offence types by age:

ggplot(iw, aes(AGE))+ geom_bar() +facet_wrap(~Offence_type)

ggplot facet barplot

We can bring a bit of colour into a stacked plot that also displays the gender split on each offence:

ggplot(iw, aes(AGE,fill=sex))+geom_bar() +facet_wrap(~Offence_type)

ggplot with stacked factor

One thing I’m not sure how to do is rip the data apart in a ggplot context so that we can display percentage breakdowns, so we could compare the percentage breakdown by offence type on sentences awarded to males vs. females, for example? If you do know how to do that, please post a comment below 😉

PS HEre’s an easy way of getting started with ggplot… use the online hosted version at http://www.yeroon.net/ggplot2/ using this data set: wightCrimRecords.csv; download the file to your computer then upload it as shown below:

yeroon.net/ggplot2

PPS I got a little way towards identifying percentage breakdowns using a crib from here. The following command:
iwp=tapply(iw$Offence_type,iw$sex,function(x){prop.table(table(x))})
generates a (multidimensional) array for the responseVar (Offence) about the groupVar (sex). I don’t know how to generate a single data frame from this, but we can create separate ones for each sex as follows:
iwpMale=data.frame(iwp['Male'])
iwpFemale=data.frame(iwp['Female'])

We can then plot these percentages using constructions of the form:
ggplot(iwp2)+geom_bar(aes(x=Male.x,y=Male.Freq))
What I haven’t worked out how to do is elegantly map from the multidimensional array to a single data.frame? If you know how, please add a comment below…(I also posted a question on Cross Validated, the stats bit of Stack Exchange…)

Maps “in the public interest” now exempt from Google Maps API charge

If you thought you couldn’t use the Google Maps API any more as a journalist, this update to the Google Geo Developers Blog should make you reconsider. From Nieman Journalism Lab:

“Certain web apps will be given blanket exemptions from charging. Here’s Google: “Maps API applications developed by non-profit organisations, applications deemed by Google to be in the public interest, and applications based in countries where we do not support Google Checkout transactions or offer Maps API Premier are exempt from these usage limits.” So nonprofit news orgs look to be in the clear, and Google could declare other news org maps apps to be “in the public interest” and free to run. (It also notes that nonprofits could be eligible for a free Maps API Premier license, which comes with extra goodies around advertising and more.)”

The best piece of Bad Journalism debunking I’ve ever seen

I’ve just stumbled across Neurobonkers’s blog post The worst piece of drugs reporting I have ever read and wanted to share it here.

The post uses an animated Prezi presentation to take the reader through 10 errors in an article in the Hull Daily Mail on the dangers of a “cheap new drug” (notably, the article is no longer online). I won’t add spoilers by revealing what those errors are – but this is a particularly engaging way to teach journalism students not only about accuracy in reporting on stories such as these, but why it’s important.

Enjoy the presentation.

.prezi-player { width: 550px; } .prezi-player-links { text-align: center; }

Finding Common Terms around a Twitter Hashtag

@aendrew sent me a link to a StackExchange question he’s just raised, in a tweet asking: “Anyone know how to find what terms surround a Twitter trend/hashtag?”

I’ve dabbled in this area before, though not addressing this question exactly, using Yahoo Pipes to find what hashtags are being used around a particular search term (Searching for Twitter Hashtags and Finding Hashtag Communities) or by members of a particular list (What’s Happening Now: Hashtags on Twitter Lists; that post also links to a pipe that identifies names of people tweeting around a particular search term.).

So what would we need a pipe to do that finds terms surrounding a twitter hashtag?

Firstly, we need to search on the tag to pull back a list of tweets containing that tag. Then we need to split the tweets into atomic elements (i.e. separate words). At this point, it might be useful to count how many times each one occurs, and display the most popular. We might also need to generate a “stop list” containing common words we aren’t really interested in (for example, the or and.

So here’s a quick hack at a pipe that does just that (Popular words round a hashtag).

For a start, I’m going to construct a string tokeniser that just searches for 100 tweets containing a particular search term, and then splits each tweet up in separate words, where words are things that are separated by white space. The pipe output is just a list of all the words from all the tweets that the search returned:

Twitter string tokeniser

You might notice the pipe also allows us to choose which page of results we want…

We can now use the helper pipe in another pipe. Firstly, let’s grab the words from a search that returns 200 tweets on the same search term. The helper pipe is called twice, once for the first page of results, once for the second page of results. The wordlists from each search query are then merged by the union block. The Rename block relabels the .content attribute as the .title attribute of each feed item.

Grab 200 tweets and check we have set the title element

The next thing we’re going to do is identify and count the unique words in the combined wordlist using the Unique block, and then sort the list accord to the number of times each word occurs.

Preliminary parsing of a wordlist

The above pipe fragment also filters the wordlist so that only words containing alphabetic characters are allowed through, as well as words with four or more characters. (The regular expression .{4,} reads: allow any string of four or more ({4,}) characters of any type (.). An expression .{5,7} would say – allow words through with length 5 to 7 characters.)

I’ve also added a short routine that implements a stop list. The regular expression pattern (?i)b(word1|word2|word3)b says: ignoring case ((?i)),try to match any of the words word1, word2, word3. (b denotes word boundary.) Note that in the filter below, some of the words in my stop list are redundant (the ones with three or fewer characters. Remember, we have already filtered the word list to show only words of length four or more characters.)

Stop list

I also added a user input that allows additional stop terms to be added (they should be pipe (|) separated, with no spaces between them). You can find the pipe here.

Strategies vs tools redux

Yesterday I chaired a panel on ‘UGC and Social Media’ at Birmingham’s Hello Culture event. Determined that it did not descend into the all-too-common obsession with tools that often characterises such discussions, I framed it from the start with the questions “Why should we care? Why should users care?”

The panellists were grateful – and the tactic seemed to work. We talked about the tension between creating content and building relationships; between the urge to ‘get people on our platform’ and going to their platforms instead. We discussed how the experience of designing physical spaces might inform how we approach designing digital ones; and about revisiting strategic priorities as a whole instead of simply trying to ‘find time’ to ‘do the online stuff’.

In other words we talked about people rather than technology, and strategies rather than tools.

So this morning it was good to be brought back down to earth and reminded just how embedded the technology-driven mindset is by Richard Millington.

Richard writes about a ‘State of Branded Online Communities’ report that uses Bravo TV as an example of a “successful” online community. The problem is that by any sensible measure, it isn’t. And I think Richard’s quotes on just how flawed the example is are worth reproducing here at length:

“If simply posting a standardized thread each week and leaving people to their own endeavours is seen as good community management practice, what exactly is bad community management? This is community management by autopilot.

“… You judge a community’s success by it’s stage in the life cycle, the number of interactions it generates, it’s members sense of community and the ROI it offers the organization. ComBlu defines success by what features the platform offers. By that assessment, nearly all of the most successful communities would be considered failures. [They struggle to get more than 10 members participating in a community at any one time.]

“ComBlu credits Bravo with an array of successes which have no impact on the community’s success. Only one suggestion is offered:

“[..] On our Bravo wish list? A better gamification or reputation management system.”

“There are a variety of things the community needs, a better gamification system certainly isn’t one of them.

“How about hiring a community manager to take responsibility for stimulating discussions […]?

“… Content sites branded as communities are still content sites.”

Ah, gamification: I’ll tip that to be next year’s QR code/Facebook page. How about an iPhone app? Everyone else is doing it so why shouldn’t we? Remember when everyone had to have a space in Second Life?

It’s a point I’ve made before in Technology is not a strategy: it’s a tool (and its follow-up), and which is explored at length in my Online Journalism book. Too often in an organisation or in a student project someone decides that they must launch a Facebook page or ‘be on Twitter’.

I recently compared this to someone approaching a TV producer, saying they wanted to make a documentary, and explaining that their strategy would be to “use a camera”.

No producer would accept that, and we need an equally critical attitude to the use of new technology. Otherwise we’re just hammers walking around seeing nails.

A case study in crowdsourcing investigative journalism part 7: Conclusions

In the final part of the research underpinning a new Help Me Investigate project I explore the qualities that successful crowdsourcing investigations shared. Previous parts are linked below:

Conclusions

Looking at the reasons that users of the site as a whole gave for not contributing to an investigation, the majority attributed this to ‘not having enough time’. Although at least one interviewee, in contrast, highlighted the simplicity and ease of contributing, it needs to be as easy and simple as possible for users to contribute (or appear to be) in order to lower the perception of effort and time needed.

Notably, the second biggest reason for not contributing was a ‘lack of personal connection with an investigation’, demonstrating the importance of the individual and social dimension of crowdsourcing. Likewise, a ‘personal interest in the issue’ was the single largest factor in someone contributing. A ‘Why should I contribute?’ feature on crowdsourcing projects may be worth considering.

Others mentioned the social dimension of crowdsourcing – the “sense of being involved in something together” – what Jenkins (2006, p244) would refer to as “consumption as a networked practice”, a motivation also identified by Yochai Benkler in his work on networks (2006). Looking at non-financial motivations behind people contributing their time to online projects, he refers to “socio-psychological reward”. He also identifies the importance of “hedonic personal gratification”. In other words, fun.

Although positive feedback formed part of the design of the site, no consideration was paid to negative feedback: users being made aware of when they were not succeeding. This element also appears to be absent from game mechanics in other crowdsourcing experiments such as The Guardian’s MPs’ expenses app.

While it is easy to talk about “Failure for free”, more could be done to identify and support failing investigations. A monthly update feature that would remind users of recent activity and – more importantly – the lack of activity might help here. The investigators in a group might be asked whether they wish to terminate the investigation in those cases, emphasising their responsibility for its progress and helping ‘clean up’ the investigations listed on the first page of the site.

However, there is also a danger in interfering too much in reducing failure. This is a natural instinct, and the establishment of a reasonable ‘success rate’ at the outset – based on the literature around crowdsourcing – helps to counter this. That was part of the design of Help Me Investigate: it was the 1-5% of questions that gained traction that would be the focus of the site. One analogy is a news conference where members throw out ideas – only a few are chosen for investment of time and energy, the rest ‘fail’.

It is the management of that tension between interfering to ensure everything succeeds (and so removing the incentive for users to be self-motivated) and not interfering at all (leaving users feeling unsupported and unmotivated) that is likely to be the key to a successful crowdsourcing project. More than a year into the project, this tension was still being negotiated.

In summing up the research into Help Me Investigate it is possible to identify five qualities which successful investigations shared: ‘Alpha users’ (highly active, who drove investigations forward); modularity (the ability to break down a large investigation into smaller discrete elements); public-ness (the ability for others to find out about an investigation); feedback (game mechanics and the pleasure of using the site); and diversity of users.

Relating these findings to other research into crowdsourcing more generally it is possible to make broader generalisations regarding how future projects might be best organised. Leadbeater (2008, p68), for example, identifies five key principles of successful collaborative projects, summed up as ‘Core’ (directly comparable to the need for alpha users identified in this research); ‘Contribute’ (large numbers, comparable to public-ness); ‘Connect’ (diversity); ‘Collaborate’ (self governance – relating indirectly to modularity); and ‘Create’ (creative pleasure – relating indirectly to feedback). Similar qualities are also identified by US investigative reporter and Knight fellow Wendy Norris in her experiments with crowdsourcing (Lavrusik, 2010).

The most notable connections here are the indirect ones. While the technology of Help Me Investigate allowed for modularity, for example, the community structure was rather flat. Leadbeater’s research (2008) and that of Lih (2009) into the development of Wikipedia and Tsui (2010, PDF) into Global Voices indicate that ‘modularity’ may be part of a wider need for ‘structure’. Conversely ‘feedback’ provides a specific, practical way for crowdsourcing projects to address users’ need for creative pleasure.

As Help Me Investigate reached its 18th month a number of changes were made to test these ideas: the code was released as open source, effectively crowdsourcing the technology itself, and a strategy was adopted to recruit niche community managers who could build expertise in particular fields, along with an advisory board that was similarly diverse. The Help Me Investigate design was replicated in a plugin which would allow anyone running a self-hosted WordPress blog to manage their own version of the site.

This separation of technology from community was a key learning outcome of the project. While the site had solved some of the technical challenges of crowdsourcing and identified the qualities of successful crowdsourced investigation, it was clear that the biggest challenge lay in connecting the increasingly networked communities that wanted to investigate public interest issues – and in a way that was both sustainable and scalable beyond the level of individual investigations.


References

  1. Arthur, Charles. Forecasting is a notoriously imprecise science – ask any meteorologist, January 29 2010, The Guardian, http://www.guardian.co.uk/technology/2010/jan/29/apple-ipad-crowdsource accessed 14/3/2011
  2. Beckett, Charlie (2008) SuperMedia, Oxford: Blackwell
  3. Belam, Martin. Whatever Paul Waugh thinks, The Guardian’s MPs Expenses crowd-sourcing experiment was no “total failure”, Currybetdotnet, March 10 2010 http://www.currybet.net/cbet_blog/2010/03/whatever-paul-waugh-thinks-the.php accessed 14/3/2011
  4. Belam, Martin. Abort? Retry? Fail? – Judging the success of the Guardian’s MP’s expenses app, Currybetdotnet, March 7 2011, http://www.currybet.net/cbet_blog/2011/03/guardian-mps-expenses-success.php accessed 14/3/2011
  5. Belam, Martin. The Guardian’s Paul Lewis on crowd-sourcing investigative journalism with Twitter, Currybetdotnet, March 10 2011, http://www.currybet.net/cbet_blog/2011/03/paul-lewis-investigative-journalism-twitter.php accessed 14/3/2011
  6. Benkler, Yochai (2006) The Wealth of Networks, New Haven: Yale University Press
  7. Bonomolo, Alessandra. Repubblica.it’s experiment with “Investigative reporting on demand”, Online Journalism Blog, March 21 2011, https://onlinejournalismblog.com/2011/03/21/repubblica-its-experiment-with-investigative-reporting-on-demand/ accessed 23/3/2011
  8. Bradshaw, Paul. Wiki Journalism: Are wikis the new blogs? Paper presented to The Future of Journalism conference, Cardiff University, September 2007, https://onlinejournalismblog.files.wordpress.com/2007/09/wiki_journalism.pdf
  9. Bradshaw, Paul. The Guardian’s tool to crowdsource MPs’ expenses data: time to play, Online Journalism Blog, June 19 2009 https://onlinejournalismblog.com/2009/06/19/the-guardian-build-a-platform-to-crowdsource-mps-expenses-data/ accessed 14/3/2011
  10. Brogan, C., & Smith, J. (2009). Trust Agents: Using the Web to Build Influence, Improve
  11. Reputation, and Earn Trust (1 ed.), New Jersey: Wiley
  12. Bruns, Axel (2005) Gatewatching, New York: Peter Lang
  13. Bruns, Axel (2008) Blogs, Wikipedia, Second Life and Beyond, New York: Peter Lang
  14. De Burgh, Hugo (2008) Investigative Journalism, London: Routledge
  15. Dondlinger, Mary Jo. Educational Video Game Design: A Review of the Literature, Journal of Applied Educational Technology Volume 4, Number 1, Spring/Summer 2007, http://www.eduquery.com/jaet/JAET4-1_Dondlinger.pdf
  16. Ellis, Justin. A perpetual motion machine for investigative reporting: CPI and PRI partner on state corruption project, Nieman Journalism Lab, March 8 2011 http://www.niemanlab.org/2011/03/a-perpetual-motion-machine-for-investigative-reporting-cpi-and-pri-partner-on-state-corruption-project/ accessed 21/3/2011
  17. Graham, John. Feedback in Game Design, Wolfire Blog, April 21 2010 http://blog.wolfire.com/2010/04/Feedback-In-Game-Design accessed 14/3/2011
  18. Grey, Stephen (2006) Ghost Plane, London: C Hurst & Co
  19. Hickman, Jon. Help Me Investigate: the social practices of investigative journalism, Paper presented to the Media Production Analysis Working Group, IAMCR, Braga, 2010, http://theplan.co.uk/help-me-investigate-the-social-practices-of-i
  20. Howe, Jeff. Gannett to Crowdsource News, Wired, November 3 2006, http://www.wired.com/software/webservices/news/2006/11/72067 accessed 14/3/2011
  21. Jenkins, Henry (2006) Convergence Culture, New York: New York University Press
  22. Lavrusik, Vadim. How Investigative Journalism Is Prospering in the Age of Social Media, Mashable, November 24 2010, http://mashable.com/2010/11/24/investigative-journalism-social-web/ accessed 14/3/2011
  23. Leadbeater (2008) We-Think, London: Profile Books
  24. Leigh, David. Help us solve the mystery of Blair’s money, The Guardian, December 1 2009, http://www.guardian.co.uk/politics/2009/dec/01/help-us-solve-blair-mystery accessed 14/3/2011
  25. Lih, Andrew (2009) The Wikipedia Revolution, London: Aurum Press
  26. Marshall, Sarah. Snow map developer creates ‘Cutsmap’ for Channel 4’s budget coverage, Journalism.co.uk, 22 March 2011, http://www.journalism.co.uk/news/snow-map-developer-creates-cutsmap-for-channel-4-s-budget-coverage/s2/a543335/ accessed 22/3/2011
  27. Morozov, Evgeny (2011) The Net Delusion, London: Allen Lane
  28. Nielsen, Jakob. Participation Inequality: Encouraging More Users to Contribute, Jakob Nielsen’s Alertbox, October 9, 2006, http://www.useit.com/alertbox/participation_inequality.html accessed 14/3/2011
  29. Paterson and Domingo (2008) Making Online News: The Ethnography of New Media Production, New York: Peter Lang
  30. Porter, Joshua (2008) Designing for the Social Web, Berkeley: New Riders
  31. Raymond, Eric S. (1999) The Cathedral and the Bazaar, New York: O’Reilly
  32. Scotney, Tom. Help Me Investigate: How working collaboratively can benefit journalists, Journalism.co.uk, August 14 2009, http://www.journalism.co.uk/news-features/help-me-investigate-how-working-collaboratively-can-benefit-journalists/s5/a535469/ accessed 21/3/2011
  33. Shirky, Clay (2008) Here Comes Everybody, London: Allen Lane
  34. Snyder, Chris. Spot.Us Launches Crowd-Funded Journalism Project, Wired, November 10, 2008, http://www.wired.com/epicenter/2008/11/spotus-launches/ accessed 21/3/2011
  35. Surowiecki, James (2005) The Wisdom of Crowds, London: Abacus
  36. Tapscott, Don & Williams, Anthony (2006) Wikinomics, London: Atlantic Books
  37. Tsui, Lokman. A Journalism of Hospitality, unpublished thesis, Presented to the Faculties of the University of Pennsylvania, 2010 http://dl.dropbox.com/u/22048/Tsui-Dissertation-Deposit-Final.pdf accessed 14/3/2011
  38. Weinberger, David (2002) Small Pieces, Loosely Joined, New York: Basic Books

What made the crowdsourcing successful? A case study in crowdsourcing investigative journalism part 6

In the penultimate part of the serialisation of research underpinning a new Help Me Investigate project I explore the qualities that successful crowdsourcing investigations shared. Previous parts are linked below:

What made the crowdsourcing successful?

Clearly, a distinction should be made between what made the investigation successful as a series of outcomes, and what made crowdsourcing successful as a method for investigative reporting. This section concerns itself with the latter.

What made the community gather, and continue to return? One hypothesis was that the nature of the investigation provided a natural cue to interested parties – The London Weekly was published on Fridays and Saturdays and there was a build up of expectation to see if a new issue would indeed appear.

The data, however, did not support this hypothesis. There was indeed a rhythm but it did not correlate to the date of publication. Wednesdays were the most popular day for people contributing to the investigation.

Upon further investigation a possible explanation was found: one of the investigation’s ‘alpha’ contributors – James Ball – had set himself a task to blog about the investigation every week. His blog posts appeared on a Wednesday.

That this turned out to be a significant factor in driving activity suggests one important lesson: talking publicly and regularly about the investigation’s progress is key to its activity and success.

This data was backed up from the interviews. One respondent mentioned the “weekly cue” explicitly. And Jon Hickman’s research also identified that investigation activity related to “events and interventions. Leadership, especially by staffers, and tasking appeared to be the main drivers of activity within the investigation.” (2010, p10)

He breaks down activity on the site into three ‘acts’, although their relationship to the success of the investigation is not explored further:

  • ‘Brainstorm’ (an initial flurry of activity, much of which is focused on scoping the investigation and recruiting)
  • ‘Consolidation’ (activity is driven by new information)
  • ‘Long tail’ (intermittent caretaker activity, such as supportive comments or occasional updates)

Networked utility

Hickman describes the site as a “centralised sub-network that suits a specific activity” (2010, p12). Importantly, this sub-network forms part of a larger ‘network of networks’ which involves spaces such as users’ blogs, Twitter, Facebook, email and other platforms and channels.

“And yet Help Me Investigate still provided a useful space for them to work within; investigators and staffers feel that the website facilitates investigation in a way that their other social media tools could not:

““It adds the structure and the knowledge base; the challenges, integration with ‘what do they know’ ability to pose questions allows groups to structure an investigation logically and facilitates collaboration.” (Interview with investigator)” (Hickman, 2010, p12)

In the London Weekly investigation the site also helped keep track of a number of discussions taking place around the web. Having been born from a discussion on Twitter, further conversations on Twitter resulted in further people signing up, along with comments threads and other online discussion. This fit the way the site was designed culturally – to be part of a network rather than asking people to do everything on-site.

The presence of ‘alpha’ users like James and Judith was crucial in driving activity on the site – a pattern observed in other successful investigations. They picked up the threads contributed by others and not only wove them together into a coherent narrative that allowed others to enter more easily, but also set the new challenges that provided ways for people to contribute. The fact that they brought with them a strong social network presence is probably also a factor – but one that needs further research.

The site had been designed to emphasise the role of the user in driving investigations. The agenda is not owned by a central publisher, but by the person posing the question – and therefore the responsibility is theirs as well. This cultural hurdle – towards acknowledging personal power and responsibility – may be the biggest one that the site has to address, and the offer of “failure for free” (Shirky, 2008), allowing users to learn what works and what doesn’t, may support that.

The fact that crowdsourcing worked well for the investigation is worth noting, as it could be broken down into separate parts and paths – most of which could be completed online: “Where does this claim come from?” “Can you find out about this person?” “What can you discover about this company?”. One person, for example, used Google Streetview to establish that the registered address of the company was a postbox. Other investigations that are less easily broken down may be less suitable for crowdsourcing – or require more effort to ensure success.

Momentum and direction

A regular supply of updates provided the investigation with momentum. The accumulation of discoveries provided valuable feedback to users, who then returned for more. In his book on Wikipedia, Andrew Lih (2009 p82) notes a similar pattern – ‘stigmergy’ – that is observed in the natural world: “The situation in which the product of previous work, rather than direct communication [induces and directs] additional labour”. An investigation without these ‘small pieces, loosely joined’ (Weinberger, 2002) might not suit crowdsourcing so well.

Hickman’s interviews with participants in the Birmingham council website investigation found a feeling of the investigation being communally owned and led:

“Certain members were good at driving the investigation forward, helping decide on what to do next, but it did not feel like anyone was in charge as such.”

“I’d say HMI had pivital role in keeping us together and focused but it felt owned by everyone.” (Hickman 2010, p10)

One problem, however, was that the number of diverging paths led to a range of potential avenues of enquiry. In the end, although the core questions were answered (was the publication a hoax and what were the bases for their claims) the investigation raised many more questions. These remained largely unanswered once the majority of users felt that their questions had been answered. As in a traditional investigation, there came a point at which those involved had to make a judgement whether they wished to invest any more time in it.

Finally, the investigation benefited from a diverse group of contributors who contributed specialist knowledge or access. Some physically visited stations where the newspaper was claiming distribution to see how many copies were being handed out. Others used advanced search techniques to track down details on the people involved and the claims being made, or to make contact with people who had had previous experiences with those behind the newspaper. The visibility of the investigation online also led to more than one ‘whistleblower’ approach providing inside information, which was not published on the site but resulted in new challenges being set.

The final part of this series outlines some conclusions to be taken from the project, and where it plans to go next.

Sentencing data update: Manchester Evening News make another splash

Since I wrote about the need for more data journalism around sentencing in August, the Manchester Evening News have been beavering away keeping track of riot sentencing data on their own patch with stories on the first 60 looters to be sentenced and the role of poverty. Last week the newspaper finally made a splash on the figures.

The collected data led to this front page story: Looters jailed straight after Manchester riots given terms 30 per cent longer than those punished later.

While another article builds up a detailed profile of the rioters with plenty of visualisation, and links to the raw data.

The MEN’s Paul Gallagher had previously told me in an email correspondence that they were expecting at least 250-300 cases to be going through the courts in total, making “enough to make a very interesting and useful dataset but not so many as to make it too big a job.

“This spreadsheet is being completed using information provided by our journalists in court. The MEN is committed to staffing every court hearing so we should be able to fill this over time. This is a trial project limited only to the riots, and I don’t know if we will do anything with other court data in future.”

At the time Paul was trying to set up a system that would see court reporters add information when they covered a case, a system that could be used to publish court data in future.

“One of the biggest problems I have found is that we can produce graphics quite easily for online using Google Fusion Tables and other tools but it is difficult to turn these into graphics that will work in print without getting a graphic designer to recreate the image.”

A couple months on Paul remarks that the project has required significant editorial resources:

“Around ten MEN journalists have either sat in court to take down details of one or more riot cases in the last three months, or have been involved in the data analysis.”

He also says the exercise has raised some questions about the use, and sharing, of court data.

“Although the names and home addresses of adult defendants are published in court reports in the media, it does not seem appropriate to include them in shared spreadsheets, or to plot them on street level maps.

“For that reason, I decided to remove the names and personal details when we plotted home addresses of defendants on a map of Greater Manchester to visualise the correlation between rioters and high levels of poverty and deprivation.

The Manchester Evening News have not decided if they will continue their data work on other non-riot-related court data, which Paul feels “begs the question why court data is not publicly available from official sources.”
“At the moment there is no other way of getting this information than to have a person sat in court at every hearing, jotting down the details in their notebook and then copying them into a spreadsheet.”

The data and visualisation was also used in last night’s Panorama: Inside The Riots. Disappointingly, the Panorama website and solitary blog post include no links to the MEN coverage or data, and the official Twitter account not only failed to link – it has failed to tweet at all in almost two weeks.