Monthly Archives: February 2020

Empathy as an investigative tool: how to map systems to come up with story ideas

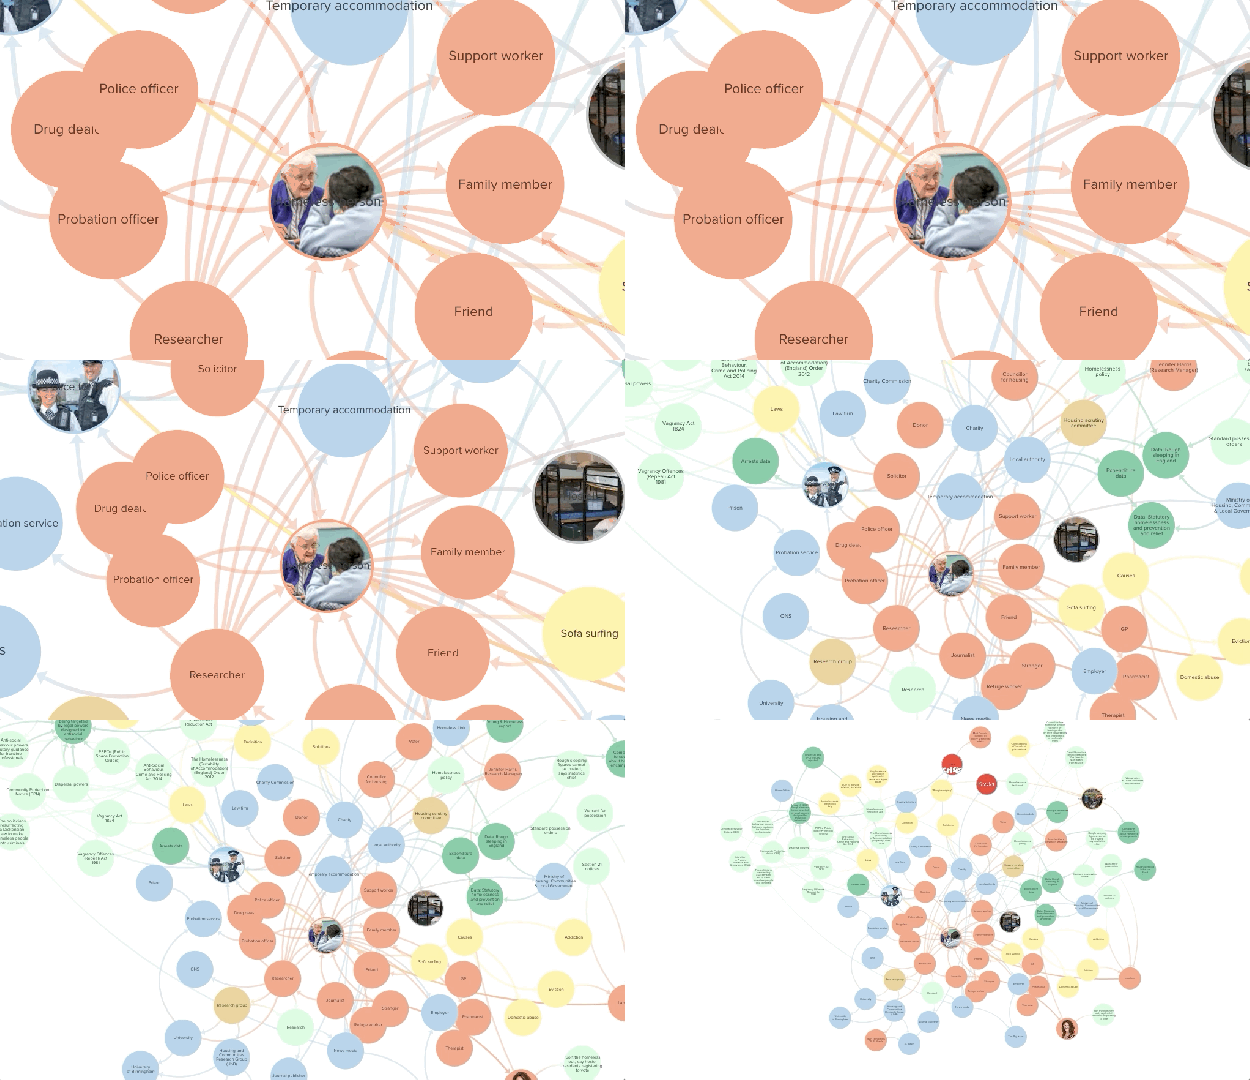
Zooming out of a network map of homelessness

By starting from one person you can start to identify the different parts of the systems that affect your topic — and useful story leads and ideas

For the last couple of weeks I’ve been helping students on my MA in Multiplatform and Mobile Journalism and MA in Data Journalism come up with story ideas for specialist reporting and investigations. Part of the process involves an exercise around scoping out a particular subject or system you are interested in — for example, the housing system, or ‘dark kitchens’, the Oscars, or air pollution — and identifying the gaps in your knowledge that can lead to stories.

It’s an exercise where empathy plays a central role.

Here’s how the process works — and why empathy is so important to it. Continue reading

It’s not all about numbers: 6 ways that data can give you a story lead

Changing figures: 'New data says X' Data leads to an interview feature or profile Data leads to reaction/action story Explainers, infographics + 'in numbers': topical context Explorers: interactives, 'mapped', 'you draw it' A story about the lack of data, or concerns over quality

It’s a common misconception of data journalism that the resulting stories will be all about numbers. In fact, the data is often just a stepping stone — it might take you to interviews, or help you find case studies; it might give you the spark for a feature idea without a single number.

Recently I was asked about these alternatives to ‘number stories’ by one of my part time PGCert Data Journalism students — so here are the 6 tips I shared with them:
Continue reading