
It’s a common misconception of data journalism that the resulting stories will be all about numbers. In fact, the data is often just a stepping stone — it might take you to interviews, or help you find case studies; it might give you the spark for a feature idea without a single number.
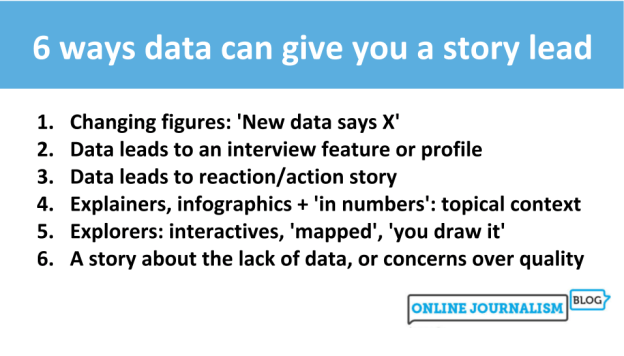
Recently I was asked about these alternatives to ‘number stories’ by one of my part time PGCert Data Journalism students — so here are the 6 tips I shared with them:
1: The basic number story: ‘New data says X’ (quick turnaround)
Let’s get this out of the way first: if you need to turn a story round in an hour or so, and the data has been released that day (or recently enough to still be new in your news cycle), then an obvious story might simply be what that data says that you can report: who’s top or bottom, what’s changed most, and so on.
The newsworthiness is provided by the data itself being new — but make sure you don’t devote more space or time to it than the story merits.
The skill here is being quick, efficient and accurate, with a quote (an expert, or a right of reply, for example) to provide a bit of context and begin to answer the “why” question (why is this top or bottom, going up or down?).
2: Data leads you to an interview feature or profile
In this scenario the data doesn’t have to be new: it just helps you identify potential interviewees (in this Vice example, the data is four years old). The interviewee won’t be in the data unless it’s about people — but their organisation or issue will be.
For example, if you identify an organisation which has seen a lot of change in the data, or is performing especially well or badly, you might approach them or their employees for an interview.
If you identify an issue which is growing in importance, or something which is growing in popularity (or the opposite) then you might seek out an expert to talk about that.
That interview is itself the ‘new information’ that you lead on (Person X says Y).
The data becomes background in the story — and it’s not in the first paragraph (unless you mention, e.g. “X teaches at the worst performing school in Birmingham”)
3: Data leads you to reaction/action story
This idea is similar to the one above, but this time it is more about helping you with what you ask rather than who you ask.
Here’s an example of how it might work: let’s say you look at data about police stopping and searching people, and see that most stops are taking place in a particular area — or that they’re going up.
The data might not be new enough to merit a story (or a very long one) so instead you seek reaction to that information: from community groups, or a charity.
And you ask the authorities what they’re doing about it.
You might even seek reaction from the charities/community groups to what the authorities have said (especially if they’re doing nothing!)
The newsworthiness in this situation is about re/action, and again the data here is background information that comes lower in the story (perhaps the second par putting the action into context) rather than the top.
The action — someone calling for more to be done; someone saying they are going to do something — may in fact be spurred by you asking the right questions. But it’s the data that tells you what questions to ask, and the information to back those up.
In the example above by Rob England, for example, the story is about the reactions that Rob came across when speaking to charities and the authorities about the figures that he’d compiled.
4: Data provides context to news story (explainers, infographics, ‘in numbers’)
The explainer format is a useful one for the data journalists. In this case the newsworthiness is provided by wider events: you are explaining something because it is in the news right now.
Again, the data doesn’t have to be new — instead you react to something that has happened in the news (that provides the topicality) to report some deeper background or analysis: an explainer basically.
So it could be “Mapping the world cup squad” or a listicle like “15 Facts That Reveal The Utter Insanity Of Britain’s Housing Market” or “How non-voters could influence this election” or an ‘In Numbers:’ piece like this, etc.
Timeliness is important here so you will need to turn this around quickly enough so that the subject is still topical by the time you hit ‘Publish’.
Typically you will use your intro to justify why you are explaining this particular thing now — such as:
“Five sperm whales died and washed up on beaches in the east of England within days of each other. But how many of the sea creatures die every year on our shores?”
Sometimes the justification doesn’t need to be explicit: “Coronavirus: How it has spread around the world” needs no explanation establishing that this subject is all over the news right now.
5: Exploratory stories: interactives, ‘mapped’, ‘you draw it’, ‘can you…’
https://twitter.com/myhlee/status/1222994404253863936
More of a feature format, this involves taking an issue and painting a picture of the ‘state of X right now’, or some other way for people to explore, or interact with, the data.
That might be through an infographic, or a map, or some sort of interactive that people can explore to “find out everything they need to know about X” (for example the refugee crisis).
I keep bookmarks of examples of infographics here, and interactives here.
6: Stories about bad data/no data
When you discover problems with data — or a lack of data — on a subject, then it is worth thinking whether that in itself is newsworthy.
If it is, you can use that data problem as a reason to interview experts and/or campaigners to find out why the problem exists, and/or tell the story of calls for better information.
I keep bookmarks of stories about bad data here, and stories about a lack of data here.
7: Add your own
Those are just 6 ways in which data can help you find and tell a story — there are almost certainly others so please do comment with any suggestions for approaches that have worked for you, or that you’ve seen elsewhere.

Pingback: 3 more angles most often used to tell data stories: explorers, relationships and bad data stories | Online Journalism Blog
Pingback: 3 more angles most often used to tell data stories: explorers, relationships and bad data stories – Blu-Ray Films
Pingback: 3 more angles most often used to tell data stories: explorers, relationships and bad data stories – Totally news
Pingback: 3 more angles most often used to tell data stories: explorers, relationships and bad data stories – WordPress Website