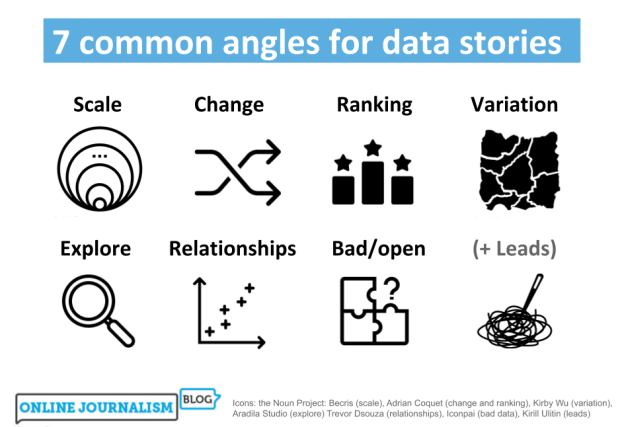
In the second of two guest posts for OJB, first published on the ML Satellites blog, MA Data Journalism student Federico Acosta Rainis uses the 8 angles used by data journalists framework to explore satellite image-driven journalism.
Satellite-driven stories don’t have to use using artificial intelligence (AI) — many can be told using satellite data alone, without. The main advantages of AI include quantifying phenomena, identifying patterns, showing changes or finding a “needle in a haystack” across large territories or different time periods.
AI algorithms can also be used to automate a process: since satellites produce recurring data, you can build, for example, a platform that automatically detects changes in the size of forests.
Paul Bradshaw’s framework for data journalism angles recognises eight types of stories: scale, change, ranking, variation, exploration, exploration, relationships, stories about data and stories through data. The same framework can be adopted to generate ideas for satellite journalism, too.
Some of the stories I propose follow existing examples; others are paths not yet travelled that are worth exploring. The underlying idea, in any case, is that they will serve as inspiration for journalists interested in exploring these techniques further.
Scale stories in satellite journalism
These are stories that allow us to quantify a phenomenon, either to provide context or to understand the scale of a problem.
Satellite information is especially useful where there is no official data, which is common in the global south, or when dealing with illegal activities. Examples might include:
- Count the number of boats fishing illegally in a country’s territorial waters
- Finding out the number of units deployed in a war
- Knowing how many animals are left of an endangered species
Stories about change using satellite data
These involve a time dimension and tell how something has (or has not) changed. Decades-old satellite data, such as from the Landsat programme, are very powerful for looking at the consequences of climate change.
Some current providers, such as Planet, produce daily images of the same location, allowing even very small changes to be monitored. Ideas include:
- Check whether a road construction (or some other publicly funded project) is running on schedule
- Measure how the size of glaciers in a region has changed
- Map how urbanisation has grown over the last few decades
Ranking stories using satellite data
These are stories that establish an order, revealing which is the best, worst or “different” in a series.
Algorithms and computational power on satellite imagery make it possible to compare very large territories, even entire countries.
Using the same dataset (the same satellite) provides an extra advantage and overcomes the problems that arise when comparing data collected in different jurisdictions, which are not always standardised. These might include:
- Find out which countries have reforested the most in the last year
- Find out which neighbourhood has the most swimming pools (and therefore consumes the most water)
- Find out which municipalities have the most open dumps
Variation stories in satellite journalism
These types of stories show differences in phenomena where, a priori, there should not be any, evidencing inequality.
As with ranking histories, always using the same dataset of satellite images allows different areas to be compared using a single criterion. For example:
- Compare water quality in different lakes or rivers
- Compare access to quality housing in the main cities of a country
- Compare the amount of green space per capita in different neighbourhoods
Exploratory stories using satellite data
Exploratory stories can encourage the user to get involved in the exploration of a phenomenon, with or without interactivity.
Satellite imagery can be used to build large maps where each reader can explore what is happening near their home. For example:
- Mapping areas destroyed in a war
- Showing the location of plastic islands in the oceans
- Identifying the location of all the football stadiums in a country
Relationship stories in satellite journalism
These pieces explore or analyse the relationship (or lack of relationship) between two different phenomena, with Bradshaw’s key caveat: correlation never implies causation.
Satellite imagery can be used to account for the two phenomena being compared; or for one of them and use other information (official data already available, for example) to account for the other. You might:
- Explore the relationship between increased deforestation and increased flooding
- Exploring the relationship between the size of a city’s green spaces and its air quality
Stories about data
These are stories about the data itself: whether it is missing, inaccurate or flawed.
Satellite imagery can be used to verify or question the quality of official datasets; missing or censored imagery is also saying something. For example:
- Detect the number of oil wells in a given area to verify whether official data is correct
- Mapping censored areas in commercial providers such as Google or Bings
- Uncovering secret facilities due to missing imagery
Story leads identified through satellite data
In these stories, data is the means to unveil or discover something. Particularly useful here is the use of AI to find patterns, infrastructure or objects in a large amount of satellite imagery. Examples could include:
- Finding unregistered airstrips in areas where illegal groups operate
- Discovering oil spills left behind by ships in the seas and oceans
- Detect military vessels in conflict scenarios
Federico is a Google News Initiative Fellow at The Guardian. You can find him on Twitter @facostarainis


