Early last week it emerged that government cybersecurity supplier Hacking Teamhad been hacked. An incredible cache of documents and emails – 400GB’s worth – was released on Sunday by the hackers, providing a fascinating – and terrifying – insight into the operations of a company dubbed one of ten “enemies of the internet” by Reporters Without Borders in 2013:
“Their products have been or are being used to commit violations of human rights and freedom of information. If these companies decided to sell to authoritarian regimes, they must have known that their products could be used to spy on journalists, dissidents and netizens.”
“[A] deal with the London cops, worth £385,000 ($591,000) to Hacking Team, was abruptly halted in in May 2014 following “internal reviews on how we wished to move this area of technology forward,” according to an email from the police, although the force left the door open for a future deal, adding: “Of course in the months/years to come this could change and if that is the case then we would welcome your organization’s participation.”
“Since then, Hacking Team has continued to try to crack the U.K. market. It tried – and apparently failed – to set up a deal with Staffordshire Police after an officer contacted the company seeking technology to “access WiFi points to check users” and infect devices to covertly collect data.”
So we have a story about a massive document leak which concerns the most powerful governments and law enforcement agencies in the world. Sound familiar?
We’ve been here before with Wikileaks, and with the Snowden revelations – two of the biggest stories of the last decade.
Hacking Team could be as big – but one week in and we’re not seeing the coverage we should. And I think that’s because of two things those stories had that Hacking Team doesn’t: a face, and a partner. Continue reading →
The proposals include the creation of a Hyperlocal Forum which will work towards a number of objectives and shared areas of interest, with initial partners including Nesta and the Carnegie Trust.
The proposals for comment are to:
introduce an external linking system, currently being rolled out to all BBC website Local Live streams across the country, to hyperlocals and bloggers, and ensuring their content is showcased and credited on the BBC website
include hyperlocal providers in training and events as part of its media partnership work
invite hyperlocal bodies to be represented on the Local Journalism Working Group and other relevant panels
ensure all local BBC teams are aware of hyperlocals operating in their area
promote an updated register of hyperlocal sites, expected to be published at the end of the year
engage with partners from across the hyperlocal community and other external media to establish a Hyperlocal Forum to meet twice a year from November.
Some of this work is already being done (particularly Local Live), but the register suggests a more comprehensive approach and linking has long been a concern.
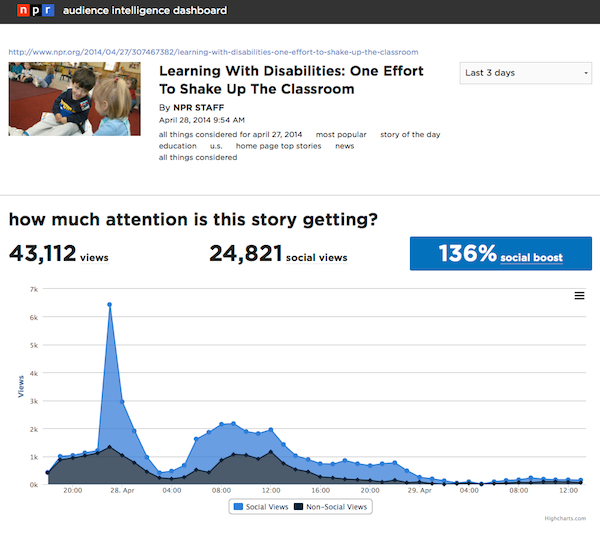
Last month I watched the founder of OpenOil, Johnny West, talk via video link about a dashboard he had designed to help people more effectively report on government announcements related to Chad’s hugely important oil industry.
The dashboard struck me in all sorts of ways: firstly in automating certain processes it lowered the barrier to more effective reporting; secondly it reduced the time needed to do so; and thirdly it turned a numerical topic into something more visual, and in the process made stories easier to spot.
More from Johnny later.
First, however, it’s worth taking stock of just how big a part dashboards play in our lives, and how little a role journalists play in their creation:
Publishers create content management systems to allow reporters and other staff to navigate between stories, media, metrics and other tools and information
Social mediaservices create dashboards as a way of navigating our networks
Analytics companies create dashboards to help users monitor the performance of their content
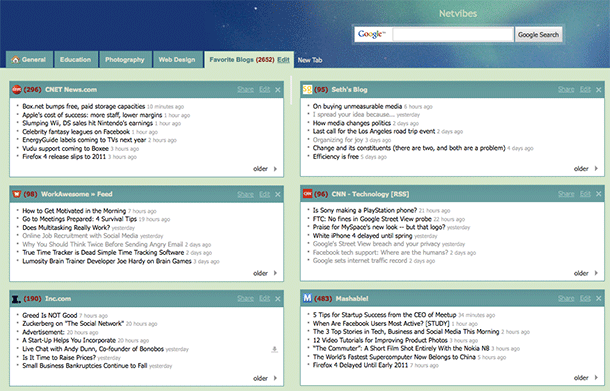
Tweetdeck and Netvibes are good examples of dashboards that save us time as journalists: specifically search time.
RSS readers like Netvibes mean that we do not need to check multiple websites or perform multiple searches to see if new information has been published or shared: instead we only need to check the Netvibes dashboard.
This Netvibes account has multiple tabs for different dashboards
In fact, we can set up more than one dashboard depending on when or where we might be using them: one for when we are covering health, for example; or another one for a specific event.
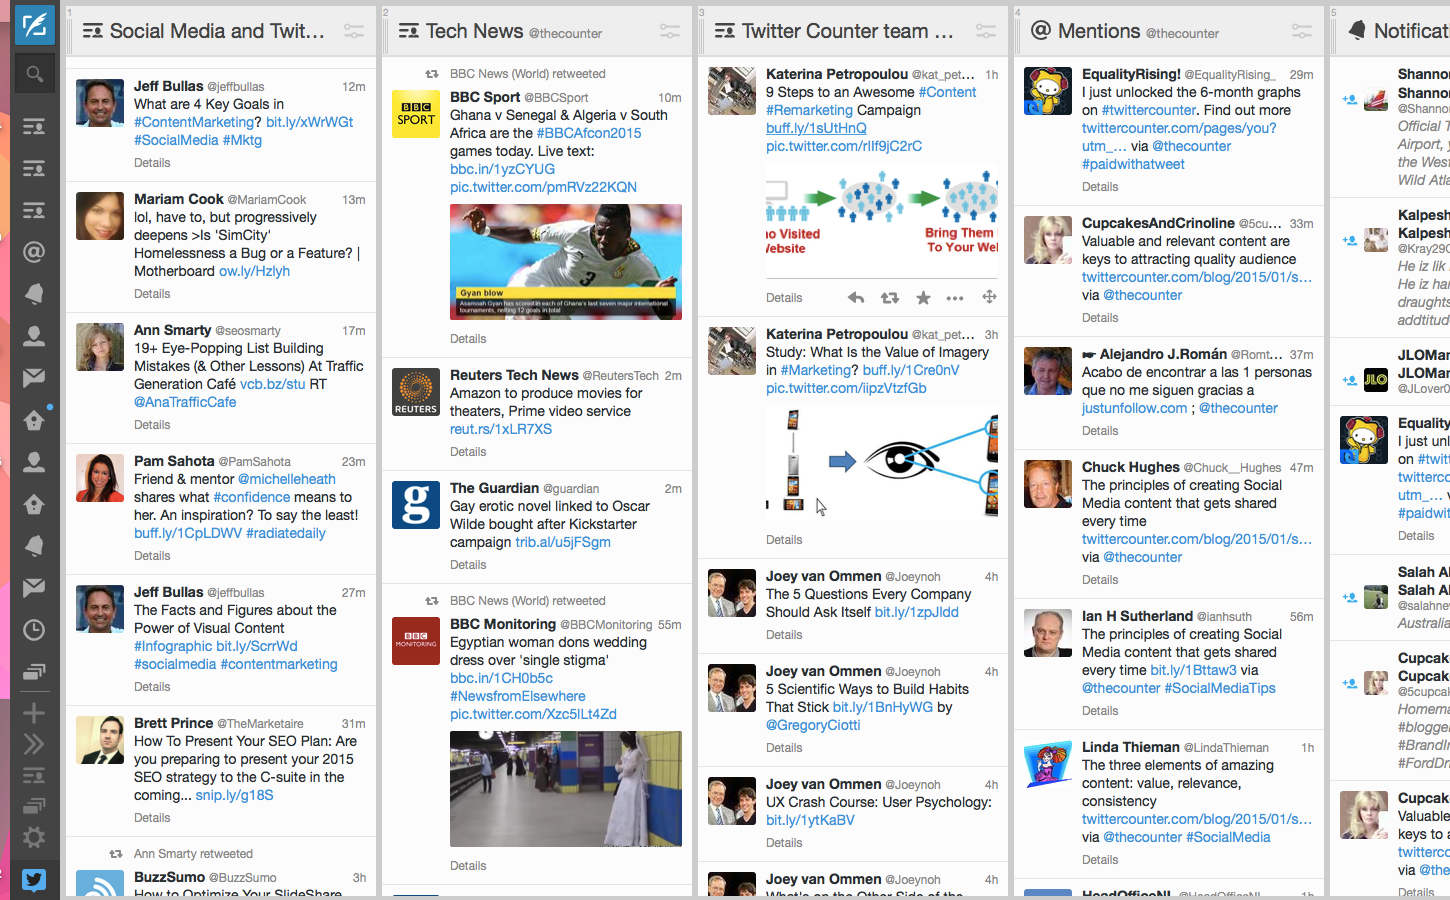
Social media management dashboards like Tweetdeck and Hootsuite perform a similar function, but more narrowly focused on social media and with the ability to publish through the dashboard too, and in some cases access analytics.
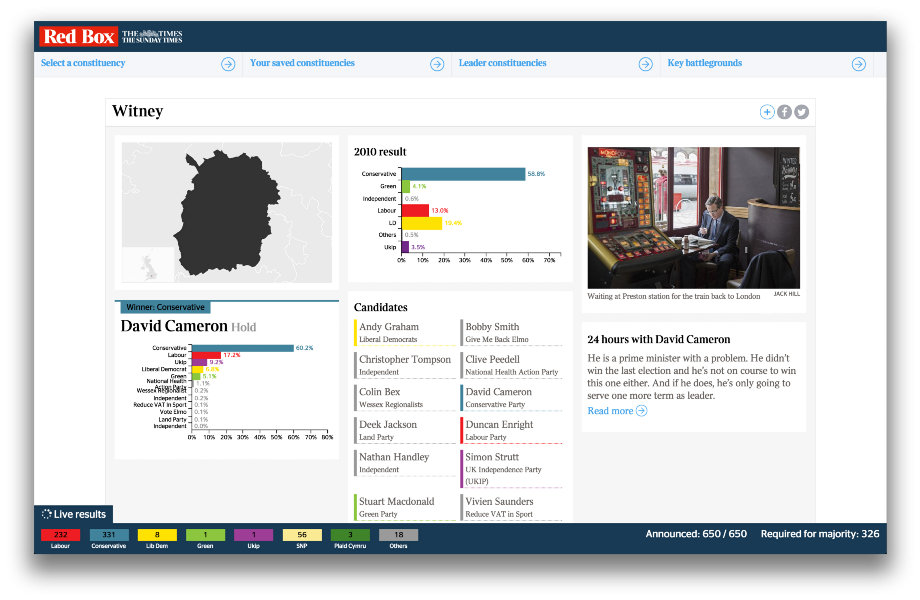
The Times’ audience-facing dashboard for the 2015 election was also useful for journalists
If you’re not using dashboards like these then you are probably wasting time unnecessarily. But these all rely on existing infrastructures, whether those are RSS feeds or social network APIs.
We can do better than that.
Dashboards that help more people hold power to account
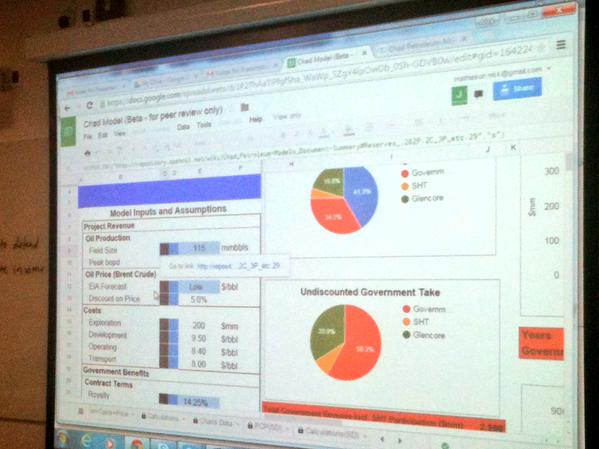
This is where Johnny West comes in. Johnny was one of the speakers at the Centre for Investigative Journalism’s recent Illicit Finance course. Here’s that dashboard he designed to make it easier to interrogate new figures from Chad’s government and oil industry:
Chad’s public finances, he explained, are over 70% dependent on oil revenues and under “severe pressure” from falls in prices. The dashboard made it easier to frame questions:
“…Of whether a budget holds up with likely revenues etc [or compare] Chad’s annual EITI reports – which state revenues actually received – with what you would expect the government to receive.”
He argues that creating a visual interface to the information the journalist needs (in this case oil prices and contract agreements) is essential:
“You cannot achieve any real understanding of the many interlocking parts of the contract and revenue flows without a model of their relationships with each other. I would not trust any financial comment or analysis of oil economics done blind to a model.
“It is a bit of a challenge to get journalists to accept this – since many of them are not familiar with or comfortable with financial models.”
One result of financial illiteracy, he argues, is an inclination towards simple but meaningless comparisons: one royalty rate being higher than another; or how much an income tax rate was raised by.
“Nine out of ten such stories are simply not accurate enough to provide any service to the reader. What if the royalty rate is lower because the income tax rate was raised? Or this one has a higher royalty because it is the second discovery in an area (with less exploration risk to the company therefore putting government in a stronger negotiating position)? And so on…”
The dashboard supports the journalist in reporting something richer despite the pressure to deliver something on deadline. And it’s not just for journalists:
“We know there are many governments which do not have models like this one for contracts they themselves negotiated and signed. It may be a question of institutional knowledge: perhaps one individual once had one, or a consultancy or visiting IMF delegation. But these get hoarded and not passed on. The need for public domain versions of these kinds of applications is critical in helping states build their capacity, not just the media.”
At a broader level there are also dashboards designed by journalists to help make their colleagues’ work easier. The Investigative Dashboard was designed a few years ago to help journalists and civil society investigate organised crime and corruption. It has subsequently had an injection of cash and a relaunch:
Those are isolated examples, but they shouldn’t be. I once created a dashboard for journalists at a Scottish newspaper to pick stories out of some data I had scraped.
It meant that journalists with very little spreadsheet skills could call up data on any one of hundreds of measures by using a drop-down menu and be shown where to focus their follow up calls instantly.
Some great original stories and big splashes came out of that, yet all it took was a little initial effort, after which dozens of stories were easy to report.
Online spreadsheet tools like Google Sheets allow us to pull in live information, using built-in functions that fetch stock prices, or scrape web tables or feeds (which themselves might be generated by scrapers).
Once we have that live information it can be connected to historical information, and display those relationships visually.
Imagine a dashboard that pulls in the latest crime reports and tells us whether they’re going up or down – and where.
Imagine the BBC’s A&E tracker redesigned for journalists as well as readers.
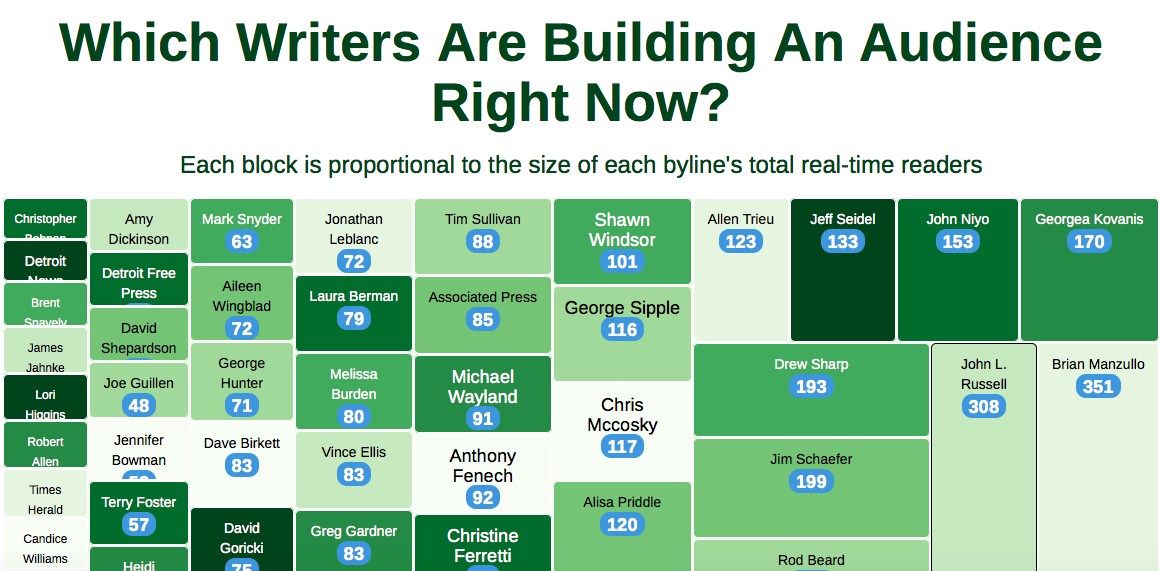
Imagine sports performance shown dynamically, so you can pick up on the most improved performers and not just the top performers.
Much of this is already happening – but it’s not being done by journalists or news organisations.
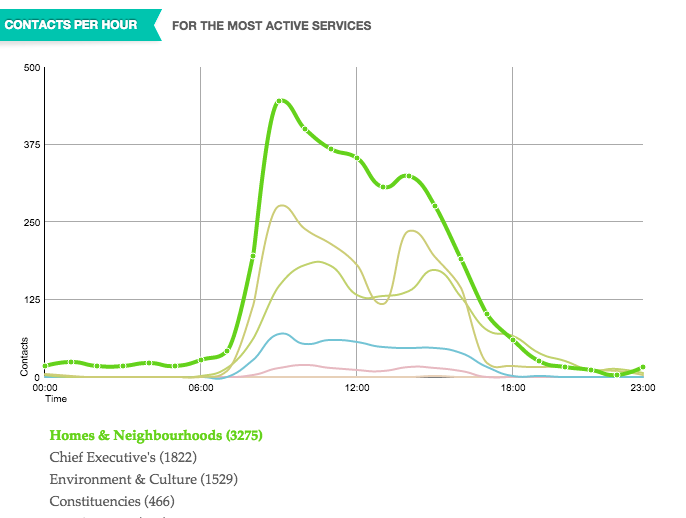
FixMyStreet has long pioneered the ability to report – and see – local problems. And Birmingham’s Civic Dashboard showed all sorts of information on things like which parts of the council were getting the most contacts and when.
The Birmingham Civic Dashboard
Expect to see more of these dashboards as the growth of ‘smart cities’ drives the connection of transport systems, policing, education, business and health.
But they’re not being done by news organisations. And that’s the point.
We need to change that.
Where data is already published we need to be setting up dashboards that bring it to the journalists. Where data is not, we need to be pushing for access to it.
Matt Burgess, the man behind FOI Directory (and the former editor of Help Me Investigate Education) has launched a new weekly email newsletter providing regular updates on developments in Freedom of Information and transparency. Continue reading →
Right at the start of my book on Excel for journalists I talk about sorting data to find out which values come top or bottom. However, there is a family of functions which will give you a lot more control in finding out not just who is top or bottom, but the rank of any value in any series of values.
This is particularly useful if you want to compare ranks.
Many stories are based on finding out where your own country or region ranks in the latest data
Ranking isn’t just about statistics – it can be used in consumer stories too
For example, say you had a table showing school performance across the last two years.
Each table shows the percentage of pupils achieving the top grades in that year. You can use RANK to find out what rank each percentage would have placed the school in for each year. Continue reading →
When people talk about data journalism the emphasis is almost always on the technicalities of the role: visualisation tools and spreadsheet formulae; scraping and cleaning; coding and mashing.
But data journalism isn’t just a technical skill – it is a cultural skill too.
Let me explain what I mean. If you were to list the technologies involved in data journalism you might start with Excel or a similar spreadsheet tool. Then add Open Refine for cleaning. Some scraping tools. Mapping tools. Some tools for charts, and infographics. Some understanding of HTML and CSS will help. Also XPath, SQL, regular expressions. JavaScript, Python or Ruby or PHP. R probably too… I could go on.
If those technologies sound like too much for one person to master all at once, you’d be right. They are.
So how do data journalists get the job done? They collaborate.
They use sites like CodePen, Stack Exchange and GitHub, where others can build on your work – and you can build on the work of others. They contribute to mailing lists; they share resources; and they work with a range of other individuals and groups.
It is an open approach to reporting that borrows more from the culture of programming than journalism’s own culture of guarding information jealously.
And understanding that culture is, for me, one of the first steps to becoming a successful data journalist.
No longer the gatekeepers
For example, notice my choice of words in the sentence two lines earlier: “contribute to”; “share”; “work with”. Sometimes journalists can make demands of communities of web developers that betray an exaggerated sense of their own importance, and an ignorance of the environments that developers often work in.
Those journalists are often given short shrift as a result of their clumsiness and lack of empathy.
If journalists were the gatekeepers of the 20th century, programmers are the gatekeepers of the 21st.
We no longer need journalists to get information to an audience; but we do need programmers to connect different parts of the networks we operate in.
Recognising this is so important that I’ve codified the requirement for understanding in my data journalism teaching at Birmingham City University and City University London.
Students at BCU on the MA in Online Journalism, for example, are required to engage with – and contribute to – wider communities of practice.
That means sharing what they learn, curating useful discussions in the community, interviewing key individuals and researching problems and questions that are important to that community.
The intention is twofold: firstly to embed good habits as a member of that community. And secondly to position them so that they are able to continue to learn not just while they are on the course, but after they graduate, as technologies and practices continue to develop.
A different culture of learning
A final difference is also important to highlight: journalists and programmers have different learning cultures.
One of the questions I am asked most often by aspiring data journalists is “What should I learn first?” My response is: “What you need to for the story you’re doing right now. And if that’s too much, then pick a simpler story then work up from there.”
If you think you learn to be a data journalist by doing Codecademy or reading a book on Python, you are likely to end up frustrated. It can be helpful – but it’s neither effective nor efficient.
The learning culture of the programmer is much more piecemeal, strategic, and reliant on others.
So I would never advise a journalist to learn a particular programming language for the sake of it. Instead learn some basic concepts in programming, such as variables, data types, loops and if/else tests, and then search the web for code that solves the problem you’re trying to solve, whether that’s “making a chart in JavaScript” or “scraping a spreadsheet in Python” or “Excel function to extract a year from a date”.
Often the next step will be a case of copying and pasting someone else’s code, and changing it slightly to see what works.
That might feel like plagiarism to a journalist, but to a programmer it is simply standing on the shoulders of giants.
Equally, if you’re trying things out in programming they often don’t work first time.
Again, that can feel like failure if you come from a humanities background. But look at it more like science: experimentation, trial and error are part of the process. In fact, programming is essentially a process of working with failure: diagnosing it, looking for solutions, and trying them with a vague expectation that it might not work.
I realised that I had learned this culture when some code of mine worked first time – and I was not only surprised – I was also vaguely disappointed. “Oh. It works. What do I do now?”
Straddling two cultures
Journalists often straddle two cultures: the sports reporter has to connect with fans, players and management; the health reporter with both doctor and patient.
In data journalism we have to draw on the same skill: only it’s not just our audience we’re connecting with, it’s the people who make those connections work.
David Higgerson writes about some depressing recent developments – and equally depressing wider trends – around the lack of transparency in public office and public spending. It’s worth reading:
“The reason this is so important now is because we are on the cusp of another wave of political restructuring. Devolution is on its way to Greater Manchester, and to other major city regions too. Whether you believe this is a good thing or not, there is hopefully no denying that with such major power moves there has to also be a cast-iron guarantee that those making decisions will be accountable.”
Magazines should be investing more effort in developing their online communities because they represent an increasingly important “strategic resource,” according to new research.
The research, “Audience Community as a Strategic Resource in Media Work” by Nando Malmelin and Mikko Villi, identifies two main advantages that publishers gain when working actively with their audience community:
Firstly, it helps strengthen engagement with, and loyalty to, the media brand
And secondly it gives journalists a deeper understanding and knowledge of their audience, making them quicker to respond to trends and better at identifying stories they know will interest that audience.
The researchers looked in particular at two successful magazines in Finland: Demi (aimed at 12-19 year old girls) and Lily (aimed at women aged 18-39).
The magazines’ two websites reach 75% and 45% of their respective target audiences, and benefit from highly active communities that actively feed into the editorial process.
As one interviewee puts it:
“If we didn’t have a community producing contents and subjects that they themselves are interested in 24/7, we wouldn’t be able to keep up to speed on what’s important to our target audience.”
4 roles in community collaboration
But collaborating with audience communities requires new kinds of journalistic practices, and the researchers identify 4 different roles that journalists adopt in this respect:
Observer
Developer
Facilitator
Curator
The observer monitors the audience community’s discussions to identify interests, needs and concerns.
The developer helps improve the online platform(s) and service so that users are more likely to contribute.
The facilitator helps start and maintain online discussions and feed those back to the editorial team. The emphasis is on stimulating, rather than driving, as one journalist points out:
“We can’t interfere too much. The biggest mistake we could make would be to decide amongst ourselves what we like at the moment and what other professionals respect and what’s in vogue for our industry, that’s perhaps the pitfall we fall into every now and then.”
Finally, the curator might highlight the best work by members of the community, both online and in print.
You might not have a community yet
Magazines are typically in a better position than newspapers when it comes to developing audience communities, and readers of speciality publications (for example hobby magazines) tend to have a stronger attachment to the brand than generic magazines – but that doesn’t mean that all magazines have a community:
“When audience members have more regular communication amongst themselves, they can be said to form an actual community; otherwise atomized media consumers simply form a crowd.”
The key question for publishers, then, may be to what extent that communication between users exists – and where.
Community management specialists such as Richard Millington tend to warn against the tendency to launch technically impressive platforms without consideration of the cultures of communities themselves. Sometimes it makes more sense to participate in existing communities than try to recreate them (another option, taken by some publishers, is to buy blog networks).Meanwhile Malmelin and Villi settle for recommending that:
“Media organisations should invest increasing effort in creating and managing audience communities … the successful operation of the media industry should in many cases be in fact as much about content production as it is about facilitating the maintenance of social relations among and with its audience.”
Steve Yelvington has a great phrase for the oft-repeated claim that newspapers ‘sowed the seeds of their own demise’ by putting their content online for free many years ago:
He calls it the ‘original sin’ myth:
“The most charitable thing I can say about it is: This is bullshit.”
I’ll let you read his post to get the full background, but as someone else who was there at the time I can only say: He’s right. What choice did publishers have? Let AOL or MSN steal an emerging fast-growing market as theirs declined?
The thing about this myth is that it relies upon some sort of ‘genie in the bottle’: the idea that news organisations had something special that they ‘let out’. That’s a nice story, but it’s only half the story. Continue reading →