One of the easiest ways to get someone started on data visualisation is to introduce them to word clouds (it also demonstrates neatly how not all data is numerical).
Using tools like Wordle and Tagxedo, you can paste in a major speech and see it visualised within a minute or so.
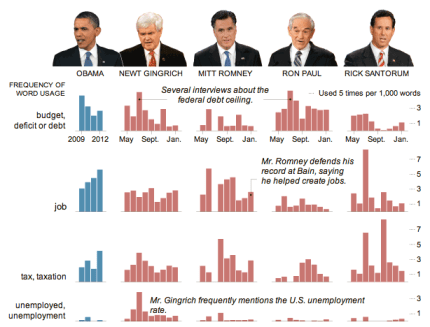
But is a word cloud the best way of visualising speeches? The New York Times appear to think otherwise. Their visualisation (above) comparing President Obama’s State of the Union address and speeches by Republican presidential candidates chooses to use something far less fashionable: the bar chart.
Why did they choose a bar chart? The key is the purpose of the chart: comparison. If your objective is to capture the spirit of a speech, or its key themes, then a word cloud can still work well, if you clean the data (see this interactive example that appeared on the New York Times in 2009).
But if you want to compare it to speeches of others – and particularly if you want to compare on specific issues such as employment or tax – then bar charts are a better choice. Compare, for example, ReadWriteWeb’s comparison of inaugural speeches, and how effective that is compared to the bar charts.
In short, don’t always reach for the obvious chart type – and be clear what you’re trying to communicate.
UPDATE: More criticism of word clouds by New York Times software architect here (via Harriet Bailey)


Pingback: Google Chart Tools « Zeeshan Akhter
Pingback: Creating Art From Words Using Wordle - Graphics Unleashed Blog