

Invisible man image by Brian
In a guest post for OJB, Help Me Investigate contributor Natalie Leal talks about how statistics on benefit claimants, migrants and A&E admissions reflect organisations’ priorities – and can be skewed as a result.
I recently witnessed an unemployed woman at a job centre shouting that she would “never ever” set foot in there again.
The woman, who had just been told that her benefits would be cut off for thirteen weeks, stormed past two security guards on her way out.
They turned to each other and joked:
“That’s another one off the books.”
As she left the job centre and walked out of sight, she dropped off the claimant count, vanished from official statistics and became one of more than a million invisible unemployed people in the UK.
Or she may find a job.
We will never know.
Trying to find out the fate of jobseekers after they are sanctioned is almost impossible: the Department for Work and Pensions (DWP) only count how many people stop claiming benefits.
Nobody in government seems to have wondered what happens after someone is cut off from all their money, so there are no figures showing how many sanctioned people continue to sign on, how many get jobs, or how many simply disappear.
Dead migrants
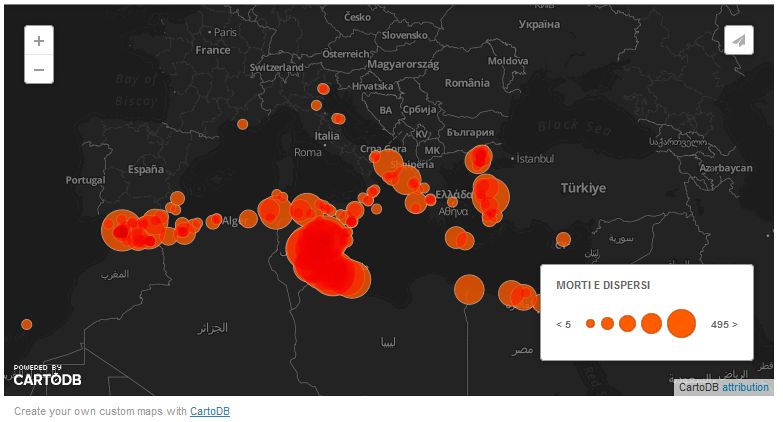
Migrant deaths image from devreporter network
At last month’s Logan Conference on surveillance, data journalist Jean-Marc Manach spoke about a similar experience: trying to find out how many people died while migrating to Europe.
When he began looking for answers he discovered that no EU member state held any data on migrants’ deaths. Why? As one public official put it, dead migrants “aren’t migrating anymore, so why care?”
His award winning project The Migrant Files filled that gap.
What counts? What’s counted?
If you want to know what those in power care about, a good place to start is to find out what data they collect.
In the case of migrants European governments tend to want to keep numbers low, so they record the people who arrive – and ignore those who never quite made it.
With unemployed people the DWP currently measure how many people leave the benefits system – not how many get jobs or start training. This is an important distinction to bear in mind when looking at figures on unemployment and employment.
This goal – the key target for job centres – is called ‘off-flow‘.
In other words, the data which is collected shows progress towards the desired outcome.
Anything (or anyone) which falls outside of this tends to be ignored.
What gets measured gets managed
A problem with these narrow targets is that they can produce nasty human consequences.
It would hardly be surprising if the DWP’s sole target of ‘off-flow’ caused jobcentre staff to start applying a few more sanctions here and there, knocking more people off benefits and improving their performance statistics.
In response to four hour waiting time goals a few years ago, A&E staff began moving people around the hospital as the time limit approached, risking the patient’s health as they tried to manage the figures.
And it’s not just pressurised employees who may change the way they do things. Those in power can do appalling things with one eye on the statistics.
This year the British government decided it would stop saving drowning migrants in the Mediterranean Sea, claiming search and rescue operations acted as a ‘pull factor’ attracting more people to Europe.
Framing the story
The official data put out by local authorities or government departments frames the picture.
Who’s counting what is important to pick apart because the numbers create the narrative. They provide statistics for press releases, for newspaper headlines and for politicians to quote in Parliament.
“What gets measured gets managed” is how the management saying goes – but often what is being managed is the public perception of an issue.
The data may show a falling claimant count, shorter A&E waiting times or fewer migrants, with no mention of the havoc caused elsewhere. As reporters we need to ask what might not be being measured – and managed – quite as visibly.
It is hard to report on what cannot be seen. If drowned migrants and destitute unemployed people are invisible in official statistics they can begin to fade from the public imagination.
Filling in the gaps
But the human cost of these policies usually appears somewhere.
Research into the impact of sanctions in Brighton showed the knock-on effect that they were having on local mental health services, probation services and emergency food providers.
The angry, upset woman who left the job centre after being sanctioned may well have shown up at her local food bank, or A&E department, within the next couple of weeks.
It is only when you begin to fill in the gaps, join the dots, or look beyond the narrow frame provided by the authorities that a truer, fuller picture begins to emerge.
It is not just what the data shows that’s important: it’s also what, and who, is missing from it.

Pingback: 10 principles for data journalism in its second decade | Online Journalism Blog