

Ben Fry published his book Visualizing Data in 2007, before the term ‘data journalism’ had entered the professional vocabulary. Since then, Fry has been developing Processing, an open source “language for learning how to code within the context of the visual arts”, and he is a principal at Fathom, a Boston design and software consultancy which has created visualisation projects for National Geographic; Bill, Hillary & Chelsea Clinton Foundation and Bill & Melinda Gates Foundation.
Catalina George asked him a few questions about his current work and his advice to aspiring data journalists.
Visualisation, a reinvented tool

For a better view of the world calories consumption, the user can see how much this differs from China to the UK @Fathom
One of your Fathom projects was a data visualisation for National Geographic’s “What the World Eats”. The graphic part can play a great role to enrich our perception and understanding of reality. But what does the development of visualisation mean for journalism?
I think what’s called “visualisation” has been around a long time for journalism. Otto Neurath was doing this in the 1920s. I think it’s been receiving more attention in recent years because we have the means to more easily distribute interactive works, which is a boon for more sophisticated takes on data.
What are the main differences between simple graphics and visualising? How does it stand out as a new way of understanding and communicating data?
It depends on what you think of as “visualising.”
For me I tend to think of infographics as being 10s, maybe hundreds of data points that can be handled by hand, and that visualisation is thousands and millions of data points, which usually means you’re working with software.
Make data interactive
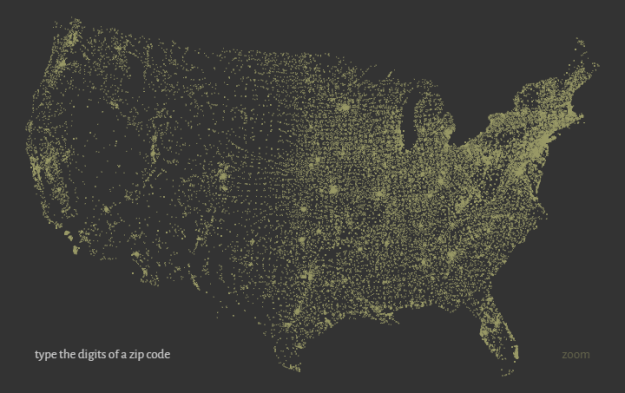
Used as an example in Visualizing Data, this early work named Zipdecode, from 1999, helped users check the geographical spread of zip codes in the US @Ben Fry
Your book, Visualizing Data, explained the main principles of effective visualisation. Is it addressed to specialists with good IT knowledge? Or is it useful to less specialised readers as well?
It’s about how to actually build a visualisation. At the time that I wrote it, there were no books that actually explained, start to finish, how to begin with a set of data, clean it, work with it, figure out what to show from it, and eventually make your way to an image or interactive piece that helps you understand the data.
There still aren’t many books that do this, but the ones that do are mostly focused on learning a specific tool or system.
So it’s intended to work for people who aren’t familiar with code, but because it has code in it, that can seem very difficult for many people coming to it.

Digital media, a necessity
Journalism today is becoming more and more digitised. What role do you think data visualisation will have in the future development of mass media?
I think it’s just a steady evolution as part of the rest of the medium. We’ve gone from print to digital, from stories that are fixed and put on press to things that are instant and available on a screen.
It’s black and white to colour, it’s still images to things that are reactive or interactive.
How do you think data visualisation will impact on the way we use information and knowledge in the future?
I see it simply as a necessity for how we deal with the ever-increasing amount of data around us.
We’ll never have less data, and so visualisation is one way for us to start working with and understanding that data.

Pingback: “It’s black and white to color”: Ben Fry on data visualization’s past and future | Liquid Newsroom
Pingback: Media Insider: Drone Filming for Beginners, The Future of Data Visualization, and Media Moves | Beyond Bylines
I want to learn this, but can’t find the code, have you the code?