

If you’re working with data as a journalist it won’t be long before you come across the phrases “dirty data” or “cleaning data“. The phrases cover a wide range of problems, and a variety of techniques for tackling them, so in this post I’m going to break down exactly what it is that makes data “dirty”, and the different cleaning strategies that a journalist might adopt in tackling them.
Four categories of dirty data problem
Look around for definitions of dirty data and the same three words will crop up: inaccurate, incomplete, or inconsistent.

Inaccurate data includes duplicate or misentered information, or data which is stored as the wrong data type.
Incomplete data might only cover particular periods of time, specific areas, or categories — or be lacking categorisation entirely.
Inconsistent data might name the same entities in different ways or mix different types of data together.
To those three common terms I would also add a fourth: data that is simply incompatible with the questions or visualisation that we want to perform with it. One of the most common cleaning tasks in data journalism, for example, is ‘reshaping‘ data from long to wide, or vice versa, so that we can aggregate or filter along particular dimensions. (More on this later).
Spotting and fixing: wrong data type and misentered data
The first clue that you have dirty data is when it doesn’t look or behave the way you expect it to. Anyone importing stop and search data from the UK’s police data portal into Excel, for example, might notice that one of the categories in the age column shows as “Oct-2017”. Why would that be a category of age?
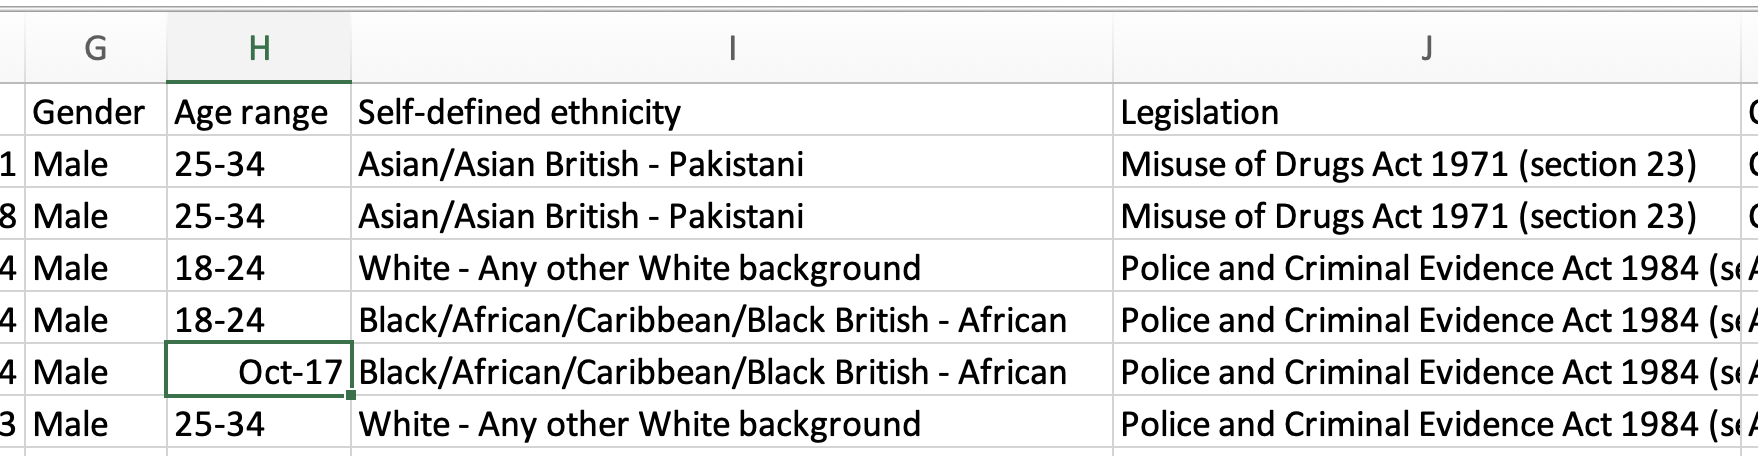
The answer is that it’s not: it’s Excel interpreting “10-17” as a date. (In 2020 scientists went as far as renaming human genes to avoid this common problem which was estimated to have affected hundreds of pieces of research).
Or you might be looking to match up company numbers and find that you find that some aren’t working as they should.
That may be because codes such as company numbers will often be stored as numerical numbers by spreadsheets, resulting in any zeroes at the front being stripped out. Those zeroes are important: a company number, it turns out, is not a number, but a code.
Data being stored as the wrong type is the problem in both cases, and this is something to look for systematically whenever importing or opening data by doing the following:
- Look down each column to check that all the entries are aligned as you would expect. Excel will align numerical values (including dates) to the right and text to the left. If the data isn’t aligned as it should be (company numbers should be aligned to the left, and dates to the right) then you have dirty data.
- Sort the column (ascending and descending): text is sorted differently to numbers, so sorting will help surface any unexpected values. If you have a column with a mix of numbers and text it will sort numbers before text (and vice versa if you sort descending).
- Add a data validation column: functions like ISNUMBER and ISTEXT will return
TRUEorFALSEdepending on whether the cell you specify contains that data type: for example=ISNUMBER(A2)will give youTRUEif A2 contains a number andFALSEif it doesn’t. You can repeat that formula down a new column to give you a result for every cell in the neighbouring column you’re checking. - Add a data measurement column: Also useful is the LEN function for telling you how many characters are in a cell (including spaces) allowing you to again sort by this to bring data of unexpected length (such as codes which aren’t consistent) to the top.
Sorting will help you gather any dirty data together in order to clean it, whether that’s manually for a small number of errors, or using Find and Replace to clean one or two mistakes on a larger scale, or problematic characters such as currency symbols. More complex problems might require you to come up with spreadsheet formulae to, for example, replace missing zeroes, replace ‘thousand’ with ‘000’, remove non-printable characters, or convert date formats.
When sorting a column look out also for any numbers that are so much larger or smaller than the rest that they might realistically have been misentered (a decimal place missing, for example). If that’s the case, you might contact the source to check if the particular figure is correct.
Before you fix any dirty data, remember to format the data type of the entire column to prevent it recurring: to do this, right-click on the column and select Format Cells. Then choose the appropriate data type.
Spotting and fixing duplicate data
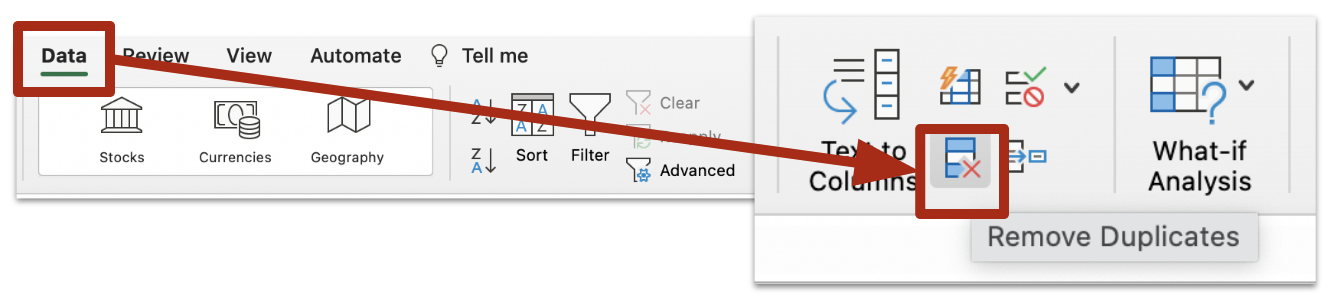
Both Excel and Google Sheets have built-in tools for detecting duplicate rows or values. Excel’s formatting button will highlight duplicates if you want to deal with them individually, or you can use its Remove Duplicates button on the Data panel to remove duplicate rows.
Google Sheets has similar formatting functionality, as well as a new Data cleanup option (in the Data menu) which will remove duplicates.
Spotting and fixing inconsistent data
Sometimes entities in a dataset are named inconsistently: a coffee shop might be named Starbucks in one row, but Starbucks Coffee in another, and Starbucks Coffee Ltd in yet another.
This can cause problems if we want to perform some form of aggregate analysis that treats them all as the same entity (this problem often becomes apparent when creating a pivot table: similar named entities will occupy separate rows when we want them all to be counted together).
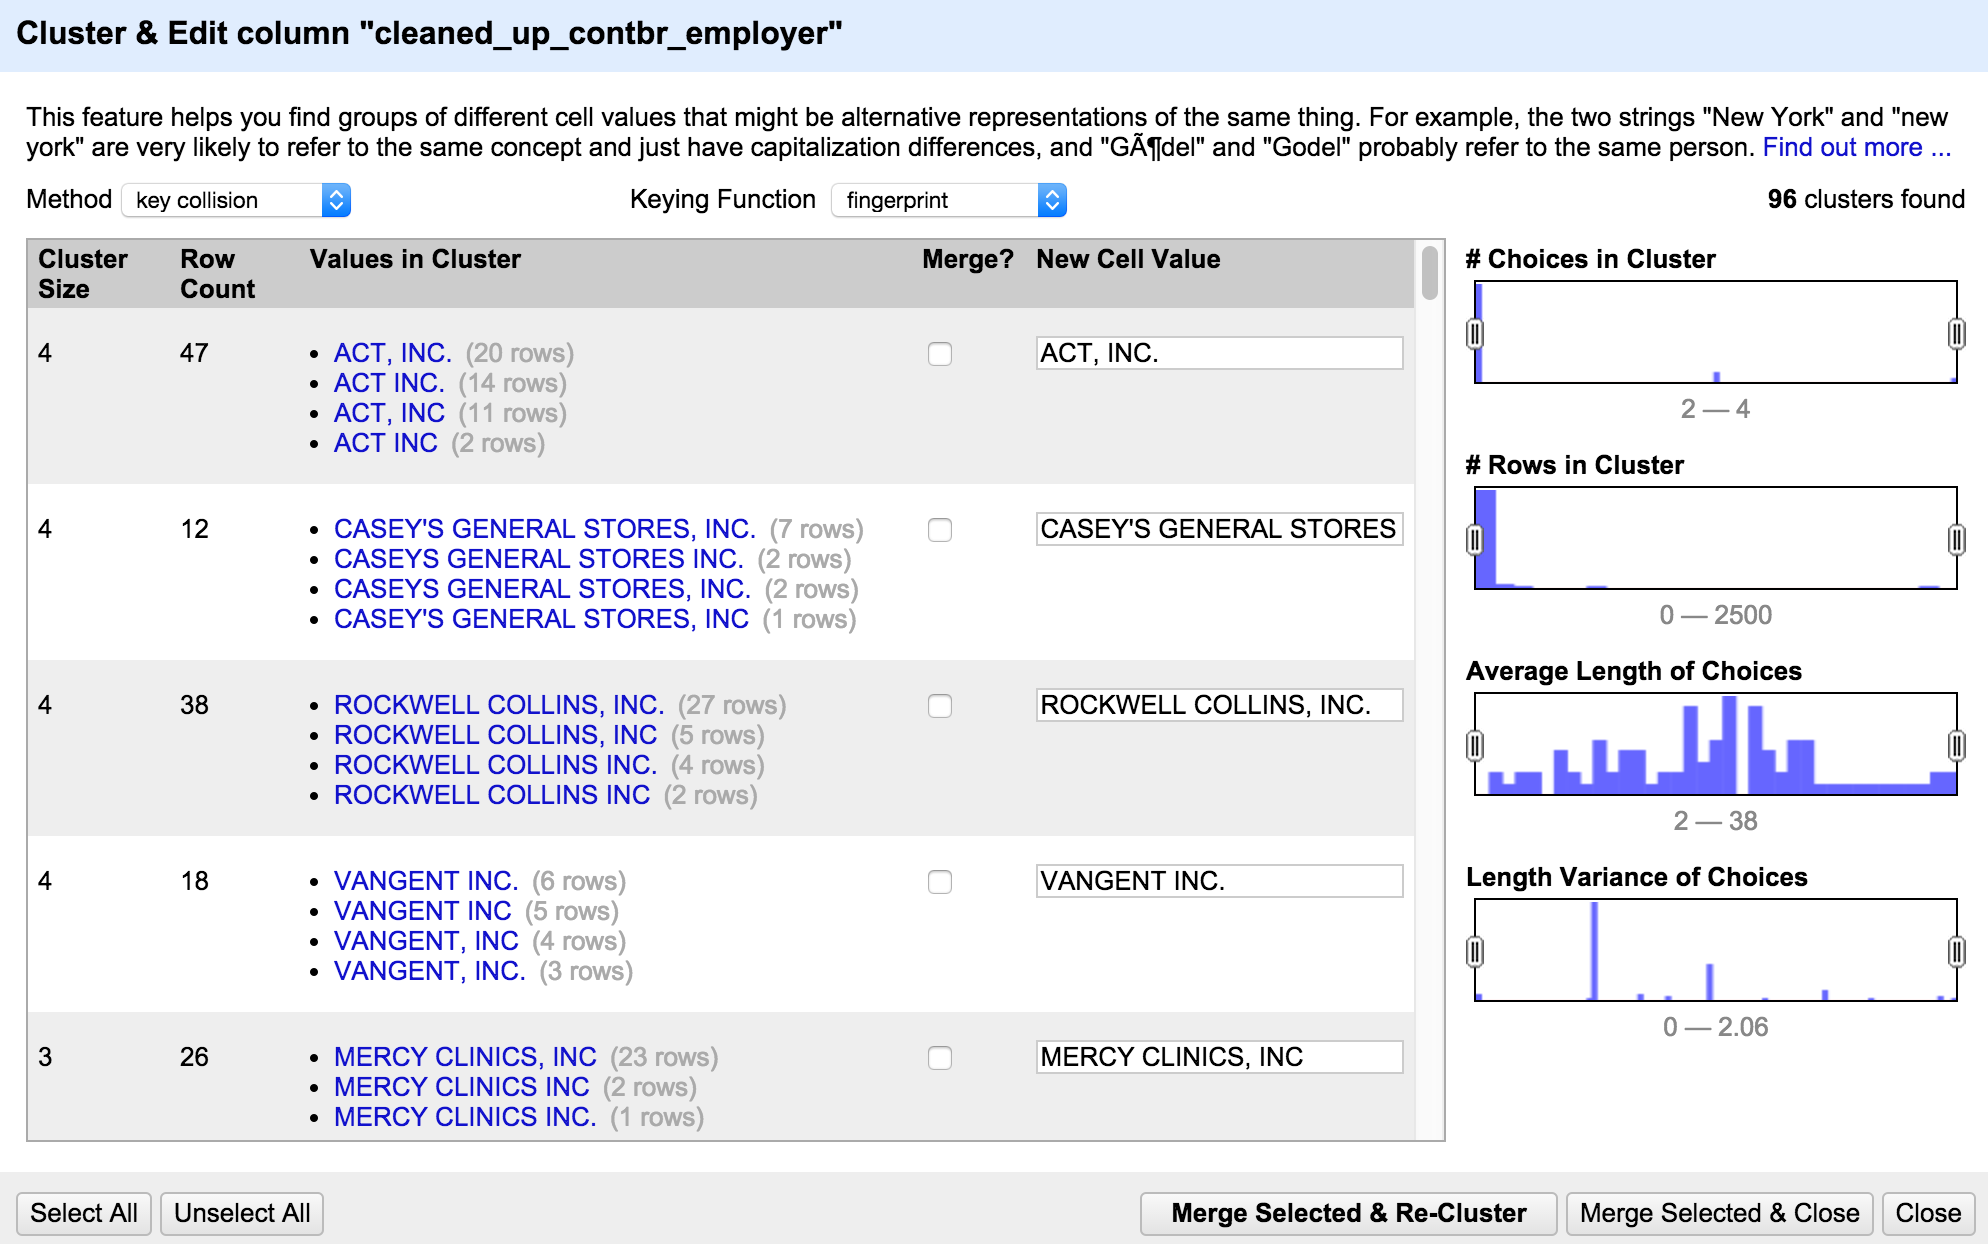
One of the best tools for dealing with this problem is Open Refine and its ‘Cluster and edit’ tool: this will group together similar entries in a column using one of a number of algorithms: you might ask it to group together similar sounding names using the ‘Phonetic fingerprint’ algorithm; or words that share most of the same characters using the ‘N-gram fingerprint’ algorithm.
You don’t need to understand the algorithms: Open Refine presents you with the resulting clusters and you can choose to clean them so that they all entries within that cluster are the same, or leave them as they were. You can try it out with my sample dataset here.
Some of the causes of such inconsistency can also be fixed without having to install Open Refine.
Extra white space, for example, can cause your spreadsheet to treat two entities separately (because one has a space where the other doesn’t). Google Sheets’s Data clean-up suggestions will identify these and remove them for you.
Inconsistent capitalisation is another common problem: this can be fixed with a new column that uses the functions PROPER or LOWER. These will take the contents of a formula and format them consistently in ‘proper’ case (each word begins with a capital) or lower case.
You can also fix other problems, such as different words being used for the same thing (‘&’ versus ‘and’, for example, or ‘Ltd’ versus ‘Limited’) with Find and Replace, or the SUBSTITUTE function.
A number of chapters in my book Finding Stories in Spreadsheets (also in Spanish) explain how to approach problems like these and useful functions for various cleaning challenges.

Spotting and fixing mixed data
Another common problem found in datasets is when data is mixed together in the same column. Sometimes this is less obvious — such as an address column that mixes the street name with the city and the area code — and sometimes it’s more noticeable, such as when one column mixes together overall categories with sub-categories.
Generally you notice this at the point when you want to analyse one aspect of the mixed data, and need to separate it out in some way to do so.
Excel’s ‘Text to Columns‘ button is especially useful in splitting out mixed data. This allows you to split one column into multiple columns based on a particular ‘delimiter’.
For example, if a column always uses a comma after the street name and before the city name, then you can use the Text to Columns wizard to use that comma as the ‘delimiter’ to put them in separate columns. Equally, if there is a space between the first and second part of a postcode, that space can be used as a delimiter with similar effects.
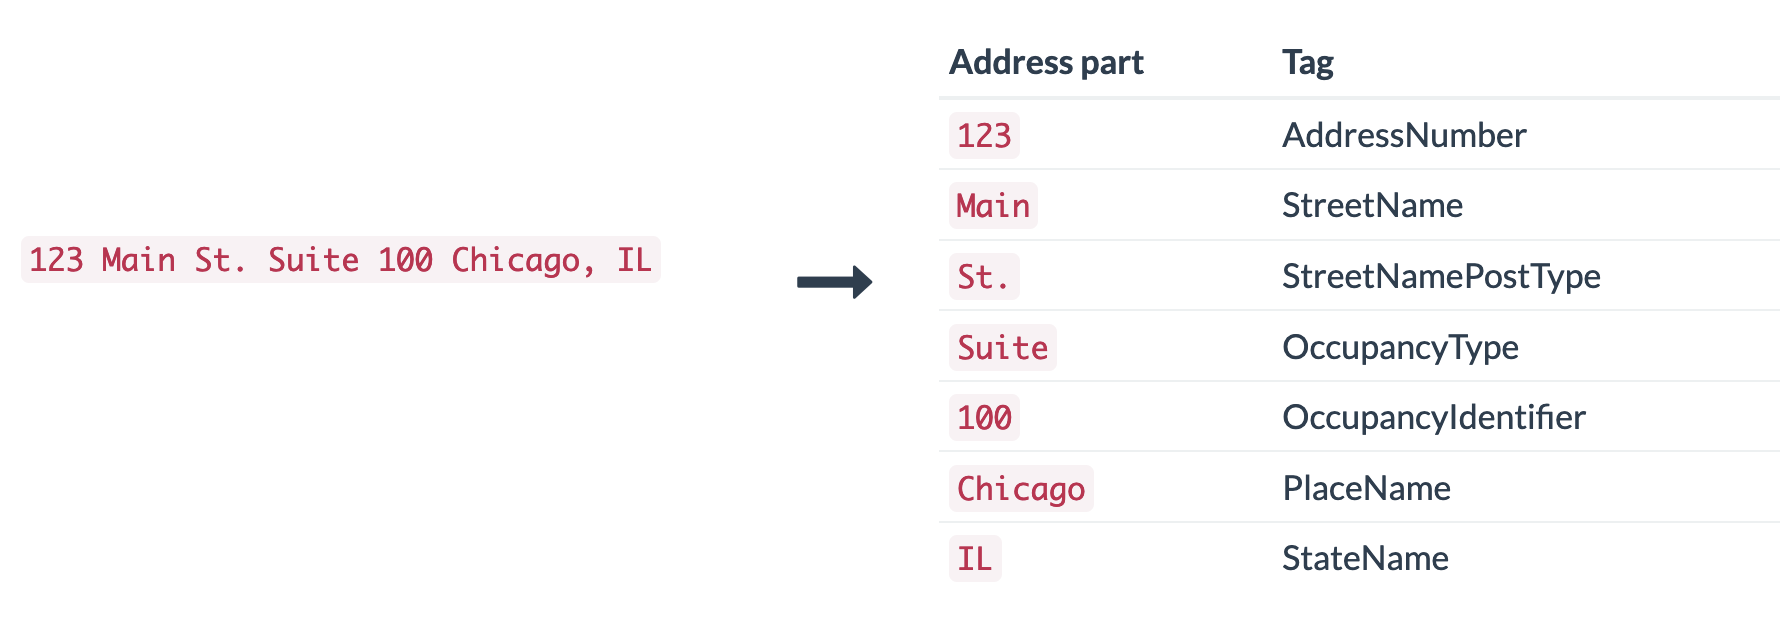
Some mixed data problems are so common that dedicated tools and codebases have been produced to tackle them: Parserator is an online tool for ‘parsing’ addresses into their individual components; while probablepeople is a Python library for parsing names and humaniformat is an equivalent in R.
For bigger challenges you might need Open Refine’s facet and filter functionality (this is especially useful where categories and sub-categories are mixed, for example).
UPDATE: Roberto Rocha in the comments points to an experiment he tried using ChatGPT to clean up name-based data which seems to work quite well. He also used ChatGPT to add missing data (company codes and categories; parent companies) with varying results.
Inconvenient data
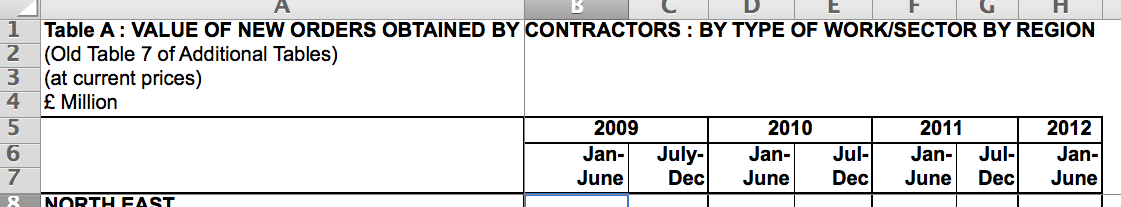
Spreadsheets that are inconveniently formatted are a particularly common challenge in data reporting. Governments are notorious for publishing spreadsheets where column headings are not on the first row, where headings might run across multiple rows, and where cells containing headings might be merged, too.
All of these things can make it difficult or impossible to sort and filter data, or to create new columns that can extract or validate that data.
A good rule of thumb when opening such a dataset is to:
- Make a copy of the spreadsheet
- Remove any rows before the column headings
- Remove any empty columns (Excel will treat this as the end of a table) and any columns that you don’t need
- If headings are across multiple rows or merged cells, create a ‘clean’ heading row so that heading data is retained — and then delete the old rows/cells.
Open Refine is, again, quite useful in tackling many of these problems. Its import wizard allows you to specify whether you want to skip any rows before the heading row, whether you want to take headings from multiple rows, and whether you want to ignore empty rows. I wrote about this in a previous blog post.
Data in the wrong ‘shape’ — and ‘Tidy data’ principles
A slightly different inconvenience is when data comes in the wrong ‘shape’. There are two broad categories of shape problem: data being ‘long’ when you want it to be ‘wide’ and vice versa.
For example, you might want to create a dataset with a column showing totals for each year (you want to make your data wide), but the data instead has a ‘year’ column, making it very long. In this situation creating a pivot table (with ‘year’ in the columns box) will often reshape the data for you.
A trickier challenge is when the data is wide — such as having a different column for each year — and you want to make it long in order to perform a different analysis. This is a bit like reverse-engineering a pivot table, converting each of those columns ‘2018’, ‘2019’, ‘2020’, and so on into values inside a column called ‘year’.
To do this often requires some coding, and both R and Python have libraries of code dedicated to this particular problem. In Python you can use the melt and pivot functions from the pandas library to reshape from wide to long or vice versa; in R the pivot_longer and pivot_wider functions from the tidyr package will do just that.
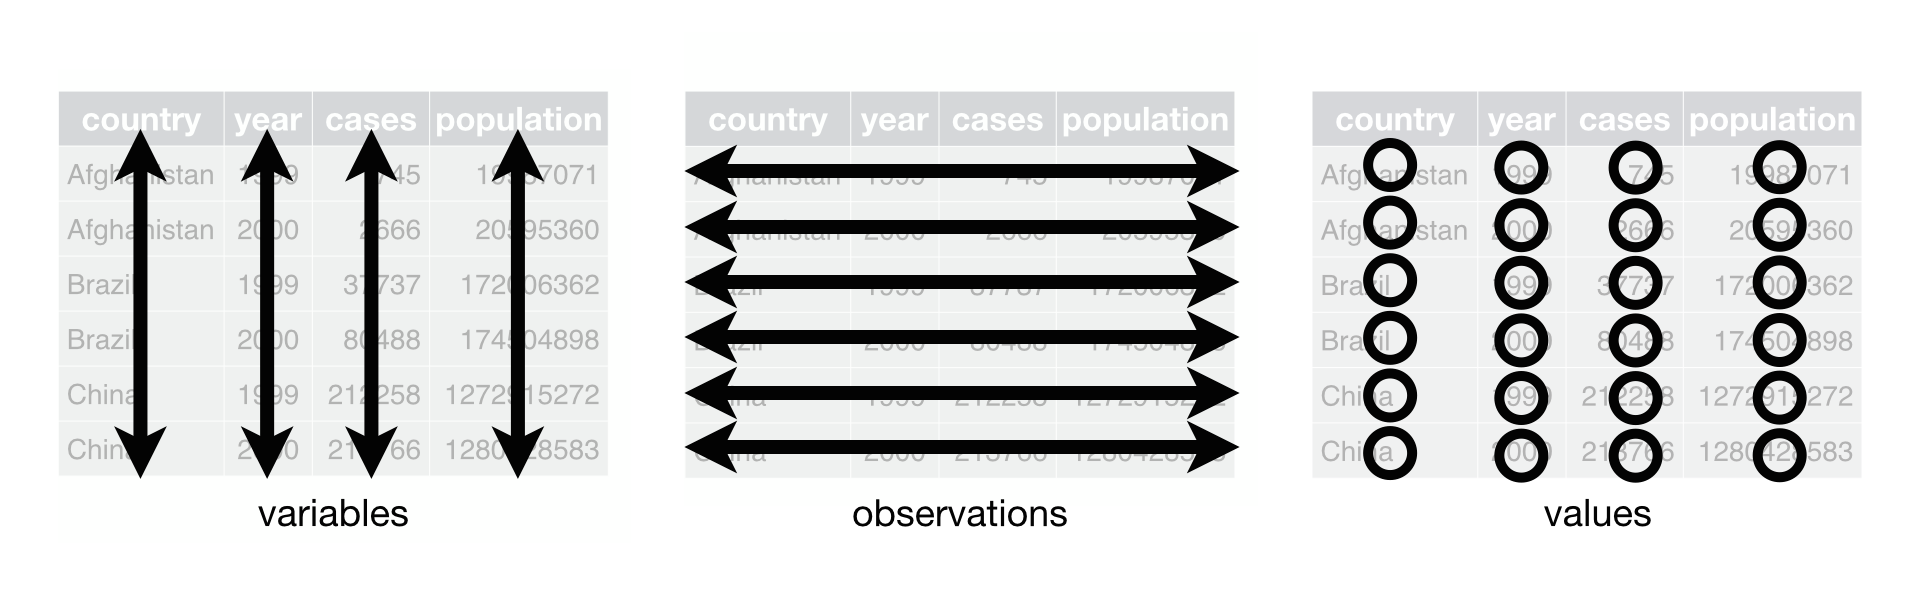
The creator of tidyr Hadley Wickham has codified some basic principles as the ‘rules of tidy data‘, proposing that tidy (or clean) data should ensure that each variable should have its own column, and each value should have its own cell.
In the example above, ‘year’ is a variable, not a value, so it should be a column. And 2020 is a value, not a variable, so it should be in a cell, not the name of a column.
Following these rules when creating your own data can ensure it is easy to analyse and avoid a lot of problems later on.
Before you start: do you *really* need to clean it?
A final note to make on all of this: cleaning can be time-consuming, so don’t embark upon major cleaning unless you know you definitely need the data to be as clean as you think.
Often when working with data there are only a few columns that are actually important to our story, so you could spend hours on a cleaning challenge only to decide later on that you didn’t need that column of data to be cleaned for the story.
Equally, a little time spent thinking about different ways to approach data cleaning can save you a lot of time later. Tools like Open Refine might require some time to learn, but you’ll often save that time and more by being able to use them instead of cleaning data manually.
If you know of any useful data cleaning tools or tips, please share them in the comments.
[UPDATE: April 2023] With perfect timing, a new research paper titled Dirty Data in the Newsroom: Comparing Data Preparation in Journalism and Data Science maps the various data journalism cleaning workflows and data cleaning taxonomies, summed up in the impressive diagram below.


Generative AI tools like ChatGPT could also be used to clean data. I did some tests that show promising applications, but more robust testing would need to be done. I wrote about it here:
https://robertorocha.info/using-chatgpt-to-clean-data-an-experiment/
This is brilliant. I love the idea of using it to add supplementary data, too. Will add it to the post.
Such a helpful post! Here’s another formatting issue I encounter — and how I teach journalism students and professionals to solve it. The issue involves merged cells in formatted data like the FBI Uniform Crime Report spreadsheets.
https://docs.google.com/document/d/1VbA8CXKQNN2J86qOudSXGZrSgZSv6n8DSCStyhf3Zvs/edit?usp=sharing
This is fabulous – thanks Jeff. How did I not know about the clear formats button in Excel?
Pingback: Post-it #13: GPT-4 ve hafıza, Yapay zekânın kara kutusu, Yanıltıcı grafikler, AutoGPT – sedaterol.com
Pingback: Los gatitos ganan, el periodismo pierde - Medianalisis
Fantastic guide! Clear and comprehensive breakdown of dirty data and practical steps for cleaning it up. As a data enthusiast, this is incredibly helpful. Thanks for sharing your insights and expertise! Looking forward to implementing these techniques in my own data journalism projects.