The most basic change to the Inverted Pyramid of Data Journalism is the recognition of a stage that precedes all others — idea generation — labelled ‘Conceive’ in the diagram above.
This is often a major stumbling block to people starting out with data journalism, and I’ve written a lot about it in recent years (see below for a full list).
The second major change is to make questioning more explicit as a process that (should) take place through all stages — not just in data analysis but in the way we question our sources, our ideas, and the reliability of the data itself.
A third change is to remove the ‘socialise‘ option from the communication pyramid: in conversation with Alexandra Stark I realised that this is covered sufficiently by the ‘utilise’ stage (i.e. making something useful socially).
Alongside the updated pyramid I’ve been using for the past few years I also wanted to round up links to a number of resources that relate to each stage. Here they are…
If you’re working with data as a journalist it won’t be long before you come across the phrases “dirty data” or “cleaning data“. The phrases cover a wide range of problems, and a variety of techniques for tackling them, so in this post I’m going to break down exactly what it is that makes data “dirty”, and the different cleaning strategies that a journalist might adopt in tackling them.
Four categories of dirty data problem
Look around for definitions of dirty data and the same three words will crop up: inaccurate, incomplete, or inconsistent.
Inaccurate data includes duplicate or misentered information, or data which is stored as the wrong data type.
Incomplete data might only cover particular periods of time, specific areas, or categories — or be lacking categorisation entirely.
Inconsistent data might name the same entities in different ways or mix different types of data together.
To those three common terms I would also add a fourth: data that is simply incompatible with the questions or visualisation that we want to perform with it. One of the most common cleaning tasks in data journalism, for example, is ‘reshaping‘ data from long to wide, or vice versa, so that we can aggregate or filter along particular dimensions. (More on this later).
If you are working with map data that uses the shapes of regions or countries, chances are you’ll need to work with KML. In this guest post (first published on her blog) Carla Pedret explains how you can use the data cleaning tool Open Refine to ‘read’ KML files in order to convert them into other formats (for example to grab the names of places contained in the file).
KML (Keyhole Markup Language) is the default format used by Google’s mapping tool Fusion Tables (Google bought the company which created it in 2004), but it is also used by other mapping tools like CartoDB.
The open source data cleaning tool Open Refine can help you to open, process and convert KML files into other formats in order to, for example, match two datasets (VLOOKUP) or create a new map with the information of the KML file.
What is the difference between XML and KML?
In this post, you will learn how to convert a KML file into XML and download it as aCSV file.
XML – Extensible Markup Language – is a language designed to describe data and it is used in RSS systems.
XML uses tags like HTML, but there is a big difference between both languages. XML defines the structure of the information, whereas HTML focuses on other elements too, including their meaning and arrangement (even when it is not supposed to focus on appearance), and the importing of other code and media.
KML – Keyhole Markup Language – documents are XML files specific for geographical annotations. KML files contain the parameters to add shapes to maps or three-dimensional Earth browsers like Google Earth.
The big advantage of KML files is the users can customize the maps according to their data and without knowing how to code.
Type what you are searching for and add the word geometry or KML.
Open the fusion table and check that it has shapes by looking for a ‘map’ view (normally this has its own tab).
You should be able to download the KML when looking at that map view by selecting File > Download.
Once downloaded, to convert the file, upload your KML in Open Refine (download Open Refine here) and click Next.
In the blue box under your data, select XML files.
Now in the preview you can see the XML file with the structure of the information.
If you want to create a map with your own data and the shapes in the KML file, you need to match the KML with your data.
The example I have used contains the shapes of local authorities in the UK. I want to match the shapes in one dataset (the KML file) with information in another dataset on which party runs each council.
The element both datasets have in common (and therefore the element which will be used to combine them) is the name of the councils. But you need to check that those elements are the same: in other words, are the councils named in exactly the same way in both datasets, including the use of ampersands and other characters?
Have a look at the XML preview and try to find the tags that contain the information you need: in this case, authority names. In the example the tags containing the authority name are <name></name>.
Hover over that element so that you get a dotted box like the one shown below. Click on that rectangle and wait until the process has finished.
You should then see a column or columns as the picture shows.
On the right hand side of the page, change the name of your file and click on Create a new project.
Once created, you now only need to export it. Click on Export and select the format you prefer.
What originally was a KML file is now a filtered list with data ready to check and match against your other dataset.
Do you use Open Refine? Leave a comment with your tips and techniques or send it to me at @Carlapedret..
One of the most useful applications of the data cleaning tool Open Refine (formerly Google Refine) is converting XML and JSON files into spreadsheets that you can interrogate in Excel.
Surprisingly, I’ve never blogged about it. Until now. Continue reading →
Journalists rarely get their hands on nice, tidy data: public bodies don’t have an interest in providing information in a structured form. So it is increasingly part of a journalist’s job to get that information into the right state before extracting patterns and stories.
A few months ago I sent a Freedom of Information request asking for the locations of all litter bins in Birmingham. But instead of sending a spreadsheet downloaded directly from their database, the spreadsheet they sent appeared to have been converted from a multiple-page PDF.
This meant all sorts of problems, from rows containing page numbers and repeated header rows, to information split across multiple rows and even pages.
In this post I’ll be taking you through I used the free data cleaning tool OpenRefine (formerly Google Refine) to tackle all these problems and create a clean version of the data. Continue reading →
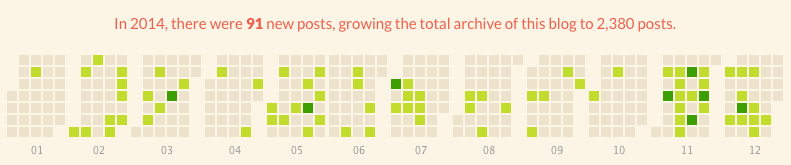
The last 2 months of 2014 saw a return to regular blogging after some quiet periods earlier in the year
2014 was the 10th anniversary of the Online Journalism Blog, so I thought I’d better begin keeping track of what each year’s most-read posts were.
In 2014 the overriding themes for this blog were programming for journalists, web security, and social media optimisation. Here are the most-read posts of the year, plus one surprisingly popular new page with some background and updates. Continue reading →
When you’ve converted data from a PDF to a spreadsheet it’s not uncommon for text to end up being split across multiple rows, like this: In this post I’ll explain how you can use Open Refine to quickly clean the data up so that the text is put back together and you have a single row for each entry. Continue reading →
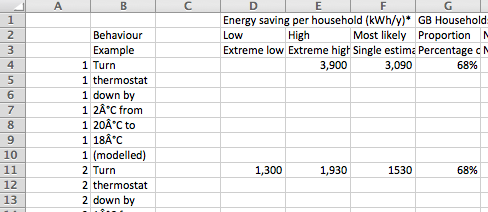
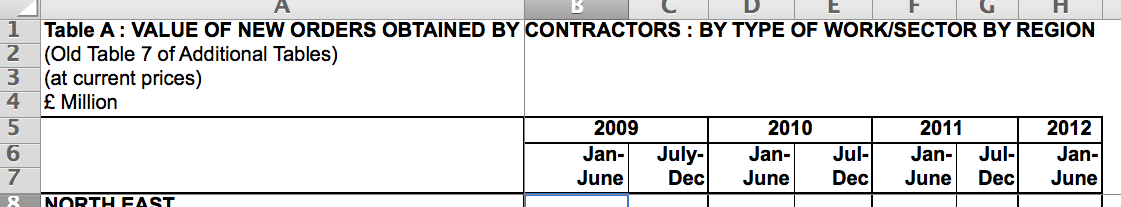
Something that infuriates me often with government datasets is the promiscuous heading. This is when a spreadsheet doesn’t just have its headings across one row, but instead splits them across two, three or more rows.
To make matters worse, there are often also extra rows before the headings explaining the spreadsheet more generally. Here’s just one offender from the ONS:
A spreadsheet with promiscuous headings
To clean this up in Excel takes several steps – but Open Refine (formerly Google Refine) does this much more quickly. In this post I’m going to walk through the five minute process there that can save you unnecessary effort in Excel. Continue reading →