Tag Archives: XLOOKUP

I’ve updated the Inverted Pyramid of Data Journalism — and brought together resources for every stage

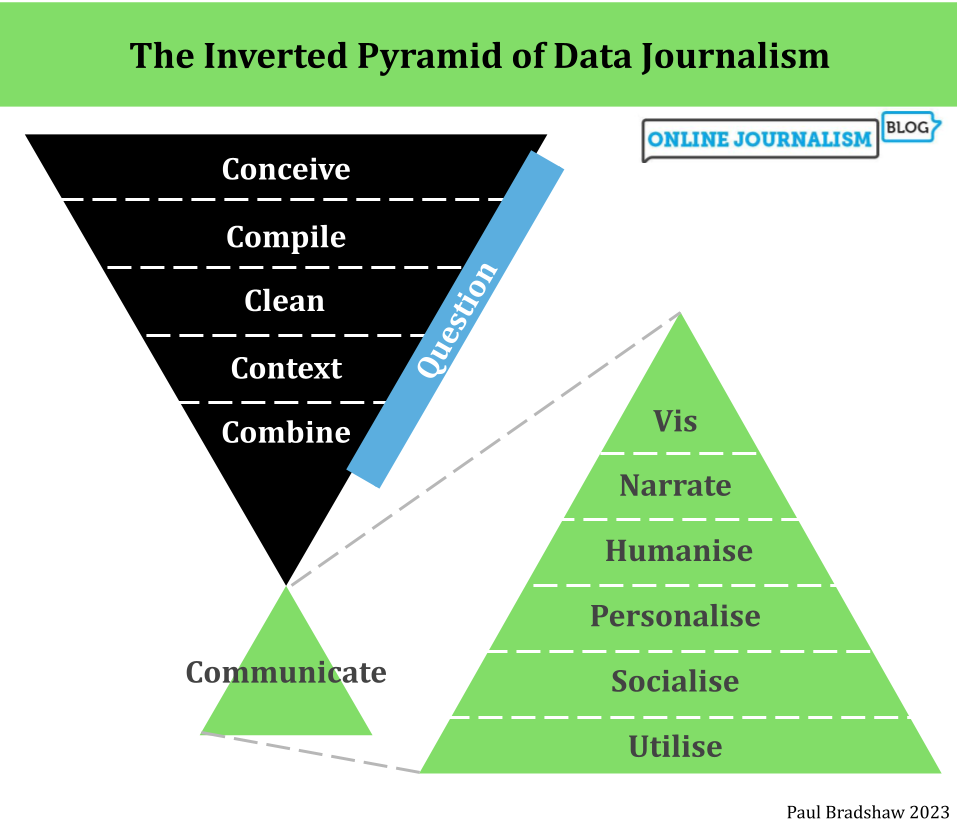
Inverted pyramid of data journalism: conceive, compile, clean, context, combine (with 'question' throughout). Communicate: vis, narrate, humanise, personalise, socialise, utilise

It’s over a decade since I published the Inverted Pyramid of Data Journalism. The model has been translated into multiple languages, taught all over the world, and included in a number of books and research papers. But in that time the model has also developed and changed through discussion and teaching, so here’s a round up of everything I’ve written or recommended on the different stages — along with a revised model in English (shown above; versions have been published before in German, Russian and Ukrainian!).

The most basic change to the Inverted Pyramid of Data Journalism is the recognition of a stage that precedes all others — idea generation — labelled ‘Conceive’ in the diagram above.

This is often a major stumbling block to people starting out with data journalism, and I’ve written a lot about it in recent years (see below for a full list).

The second major change is to make questioning more explicit as a process that (should) take place through all stages — not just in data analysis but in the way we question our sources, our ideas, and the reliability of the data itself.

Alongside the updated pyramid I’ve been using for the past few years I also wanted to round up links to a number of resources that relate to each stage. Here they are…

Continue reading

How to combine two datasets to put a story into context (book extract)

One of the most common challenges in a data-driven story is combining two sets of data — such as events and populations — to put a story into context. In an extract from the ebook Finding Stories in Spreadsheets, I explain how to use lookup functions to combine two tables. The longer ebook version of this tutorial includes a dataset and exercise to employ these techniques.

Combining data is often a great way of telling new stories about spreadsheets. For example: you may have one table showing pass rates for each school in an area, and another table showing their addresses. Combining these would allow you to identify geographical patterns, or to place them on a map.

You could also combine the addresses with poverty rates for different locations, or unemployment to see if there’s a possible relationship (remembering that correlation does not equal causation), or to identify the schools performing particularly well despite local conditions. In the video below, for example, I walk through an example of combining data on different sports teams’ attendances with data on their rankings, allowing you to see who’s attracting large crowds despite their poor performance.

The VLOOKUP function is one of the most widely-used tools in combining data in this way. It stands for Vertical lookup, and means that the spreadsheet will look up and down a column (i.e. vertically) for whatever you ask it. In more recent versions of Excel the XLOOKUP function has been introduced to make the process easier — but the process is similar for both.

Continue reading