

Just because a sample is big, doesn’t mean it’s representative of the people you’re looking for. Image by Sreejith K
One of the things reporters should always be careful about when reporting on research or statistics is sample sizes: the smaller sample, the wider the margin for error when generalising to the population as a whole (more on sampling here and here).
But sometimes the sample size is less obvious than you think.
Take, for example, the Labour Force Survey (LFS). It’s a pretty big sample size – around 100,000 people – but only if your story is about the labour force as a whole.
This week the House of Commons Library blog decided to use a Daily Express article on immigration as the starting point for an explanation of why “the most complete data source for measuring the impacts of migration on the UK labour market” might not necessarily be the most reliable source when it comes to a small section of that labour market.
If your story is about a part of that sample – in this case – housing benefit claimants born in Pakistan or Bangladesh – then you need to check how many of that population is included in the larger sample.
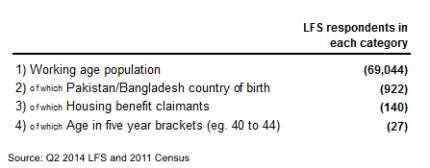
In this case the LFS only manages to record a very small sample of the wider population. Of the working age population born in Pakistan and Bangladesh, for example, the House of Commons Library blog notes that “the LFS has only 895 – reflecting coverage of 0.15%” of the 595,000+ people in the population as a whole that we are talking about (based on the 2011 Census).
But this story is about an even more specific group of people: housing benefit claimants aged 40-44. How many of those are in the LFS sample?
“For the group showing the largest disparity between UK and Pakistan and Bangladesh claimants (40-44yrs), we are left with 27 individuals. Thus the claim that migrants aged 40 to 44 and born in Pakistan and Bangladesh have a 10 point higher rate of housing benefit claims is based on 27 survey respondents.”
You can pile on other issues such as where those people live:
“London has the second highest housing benefit claimant rate for people of all countries of birth. Thus if respondents born in Pakistan or Bangladesh are disproportionately concentrated in the capital, it follows that they are more likely to have higher rates of housing because of where they live, not necessarily because of their status as migrants.”
Under-represented groups
The same problem crops up every time journalists want to report on under-represented groups like ethnic minorities.
The Independent’s report on the use of illegal abortion by UK ethnic groups was criticised for similar issues, and the Guardian were warned by the ONS about the same problem with regard to gender when reporting on unemployment among young black males.
Certain groups tend to be consistently under-represented in surveys depending on how the survey is conducted. Surveys conducted using the internet will not include people without internet access; telephone surveys may under-represent people without landlines. And face-to-face surveys rely on respondents being present and willing to engage. One analysis of what went wrong with election polls this year, for example, notes that “people over the age of 80 were underrepresented and people in their early 60s were overrepresented”.
The New Statesman’s Declan Gaffney handled a similar issue particularly well when reporting on the Centre for Social Justice’s claims of “men deserts in many areas in the UK”
“What we have is not a problem of women deserts or of men deserts but of the inappropriate use of small area data. Lower layer super output areas contain an average of 672 households: a handful of suburban streets, or an area of a few hundred metres radius in densely populated urban areas. When we are dealing with very small areas, we expect to get extreme values at either end of the distribution.”
So if you’re preparing a story which relies on small part of a large survey, make sure to find out just how small that part is: if it’s just 27 people, you might need to rethink your approach.

Pingback: Ethical Journalism Newsletter: August 4, 2015 - Ethical Journalism Network
Pingback: Ethical Journalism Newsletter: August 4, 2015 - Ethical Journalism Network