Computational thinking helps you break down a problem and solve each part logically. Image from BuzzFeed Tennis investigation
Today I will be introducing my MA Data Journalism students to computational thinking techniques (you can read my post about why that’s important here). As part of my preparations I’ve been collecting some of my favourite examples of computational thinking being used to spot and execute data journalism stories – and I’m sharing them here…
Story 1: Which singer has the biggest vocal range?
 This story, published in the UK tabloid newspaper The Mirror, is a great example of understanding how a computer might ‘see’ information and be able to help you extract a story from it.
The data behind the story is a collection of over 300,000 pieces of sheet music. On paper that music would be a collection of ink on paper. But because that has now been digitised, it is now quantified.
That means we can perform calculations and comparisons against it. We could:
- Count the number of notes
- Calculate the variety (number of different) of notes
- Identify the most common notes
- Identify the notes with the maximum value
- Identify the notes with the minimum value
- Calculate a ‘range’ by subtracting the minimum from the maximum
The journalist has seen this, and decided that the last option has perhaps the most potential to be newsworthy – we assume some singers have wider ranges than others, and the reality may surprise us (a quality of newsworthiness).
Of course getting to that story requires a great deal of technical skill – acquiring the data may necessitate using or writing a scraper; script may be required to identify the highest and lowest note in each song, then to associate that with an artist, and finally to aggregate the highest and lowest note by artist.
There’s also some filtering here in looking specifically at UK artists – that may require more data which then needs to be combined with the sheet music data. All of this requires further computational thinking.
But the fundamental idea isn’t about technical skill – it’s an editorial and logical one.
Story 2: Gendered dialogue in film scripts

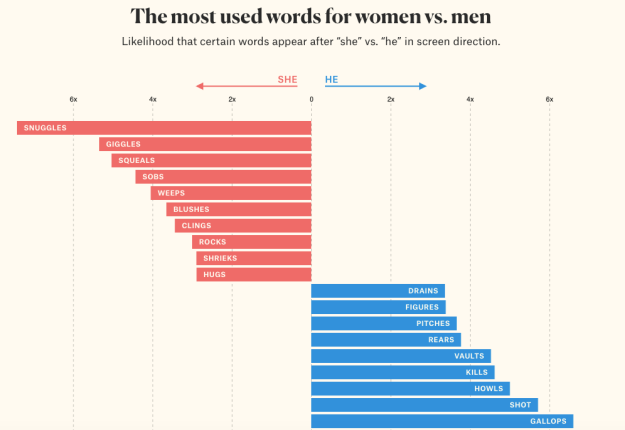
The second example – She Giggles, He Gallops – is an example of pattern recognition: the writer realises that she can investigate gender representation in films by looking for the verbs that come after the words ‘he’ and ‘she’.
Text, like music, is merely ink on paper in an analogue world – but online it is quantifiable: it only needs a piece of code to say ‘go through each film script, look for the word “he” or “she”, and when you find it, capture the word immediately after it’ (an algorithm).
From there it’s about filtering (removing non verbs), counting/aggregating, and sorting (which words appear most often against each gender).
Story 3: BuzzFeed – The Tennis Racket

BuzzFeed’s investigation into potential match fixing in tennis was a major undertaking, and involved some particularly advanced coding skills – but working out how to investigate such a subject was just as important as the technical execution.
The story was a good example of decomposition: breaking a problem down into a series of smaller ones. These included:
- How is match fixing quantified?
- Where would that be recorded?
- How do we get hold of that data?
- How do we establish some level of proof?
This is all about looking for signals of something in the physical world, in the digital world. Here’s some of the abstraction that took place next:
- Why does match fixing take place? So the fixers can make money through gambling
- How do they make money? By placing large bets and/or at longer odds
- Longer odds mean that results must be unexpected
- What happens when those bets are made? The odds change notably so bookmakers can reduce their risks
This requires some knowledge of and/or exploration of the systems of match fixing and bookmakers, by the way.
Now the initial plan might be to get hold of records of the bets made on matches – but bookmakers are unlikely to cooperate with such an approach. So assuming that an approach has been made – and declined – we move onto a secondary signal: significant swings in odds in the lead up to a match.
By pairing those with unexpected results, the journalists can identify areas for further investigation: do particular players keep recurring in those results?
A more detailed methodology is available on their GitHub repo, including data and notebooks.
Story 4: Trump’s Android versus his assistants’ iPhone

Image from Washington Post
David Robinson’s work on Donald Trump’s tweets – which he was asked to write up for the Washington Post is another story of pattern recognition – in this case, different tones of voice coming from Donald Trump’s tweets, and meta data associated with those (whether updates came from Twitter for iPhone or Twitter for Android).
There’s also a level of abstraction here in identifying core words which represent a particular tone of voice.
Test your own computational thinking
These are just 4 examples – I’d love to know of others. In the meantime, you can build your own computational thinking skills with this tutorial on fixing spreadsheet dates in different formats, and this tutorial on calculating ages in Excel, and test them with this exercise on splitting postcodes.
UPDATE: More examples of computational thinking
After this post was first published members of the NICAR-L mailing list suggested some other examples. Many of them are computational not just in thinking but in execution too. Here they are:
Max Lee highlighted an investigative series by The Atlanta Journal Contitution. “The reporters scraped through state medical board case decision websites and mined through PDF orders in order to find doctors who were found to have abused patients”. You can read more about the methodology here, which involved an initial scoping phase with a legal expert (decomposition), a pubic records request phase, then scraping (pattern recognition, algorithms), and manual filtering (abstraction).
Jacqueline Kazil pointed to this Washington Post piece by Jennifer Stark and Nicholas Diakopoulos, on the discriminatory side-effects of Uber’s surge pricing algorithm, in which they explain:
“We didn’t want to miss any surges, so we chose three minutes, knowing that surges in D.C. are no shorter than three minutes. The surge-pricing data was then used to calculate the percentage of time surging. Data were analyzed by census tracts, which are geographic areas used for census tabulations, so that we could test for relationships with demographic information. Only uberX cars were included in our analysis since they are the most common type of car on Uber. (In the interest of making the data analysis transparent, all our code can be viewed online.)”
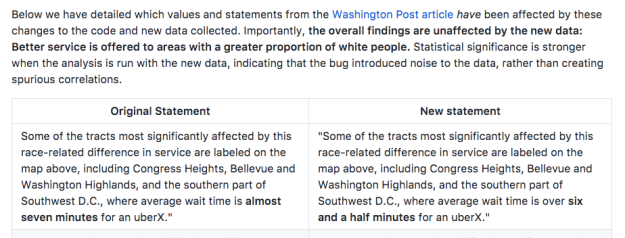
That GitHub repo is an excellent example of why sharing methodology is important. It allowed one user to submit an ‘issue’ (problem) with the script, that led to it being fixed and the text of the article improved to more accurately reflect the findings. The repo readme file shows a side-by-side comparison of how the original article text was changed as a result.

How the GitHub repo explained what they changed in the article
Peter Aldhous adds an example of his from BuzzFeed: BuzzFeed News Trained A Computer To Search For Hidden Spy Planes. This Is What We Found. Again there’s a GitHub page explaining the methods employed, and a GitHub repo with the data and an R Markdown file.
The project includes examples of abstraction (in this case, filtering) and algorithms (in this case the random forest algorithm).
Another Trump tweet analysis came from David Eads, this one from NPR looking at sentiment. He writes:
“Danielle Kurtzleben and I took the Trump Twitter Archive and ran the tweets through VADER, a sentiment analysis algorithm tuned for short strings.
“It was a tiny project — a couple hours of reading the VADER paper and some other work on NPL/sentiment analysis, a few hours of Jupyter note booking (which we released), and a lot of talking through what it all meant.
“I’m a big fan of this kind of quick-turn computation work, and it’s cool when it makes its way into a format like radio that people tend to say is hard to use data with.”
Lucia Walinchus highlights examples among IRE award winners – particularly the Houston Chronicle’s Chemical Breakdown and Denied: How Texas Keeps Tens of Thousands of Children Out of Special Education – and the election review series on FiveThirtyEight.
And Mark Lajole told me about “Bhumika Can Speak for Herself” which “used voice recognition and natural language processing provided by IBM’s Watson to create an interactive interview with a Nepali transgender rights activist”. It won the SOPA award in Asia for journalistic innovation

Reblogged this on Matthews' Blog.
Pingback: 4 ejemplos de pensamiento computacional en periodismo | Fopea | Foro de Periodismo Argentino
Pingback: 4 ejemplos de pensamiento computacional en el periodismo – Periodismo . com
Pingback: 4 ejemplos de pensamiento computacional en el periodismo – Radio Fun
Pingback: Designing data journalism courses: reflections on a decade of teaching | Online Journalism Blog