Previously I wrote about four of the 7 angles that are used to tell stories about data. In this second part I look at the three further angles: those stories focusing on relationships; ‘meta data’ angles that focus on data’s absence, poor quality, or collection — and exploratory features that mix multiple angles or provide an opportunity to get to the grips with the data itself.
Data angle 5. ‘Explore’: tools, interactivity — and art
There are two broad categories of exploratory story:
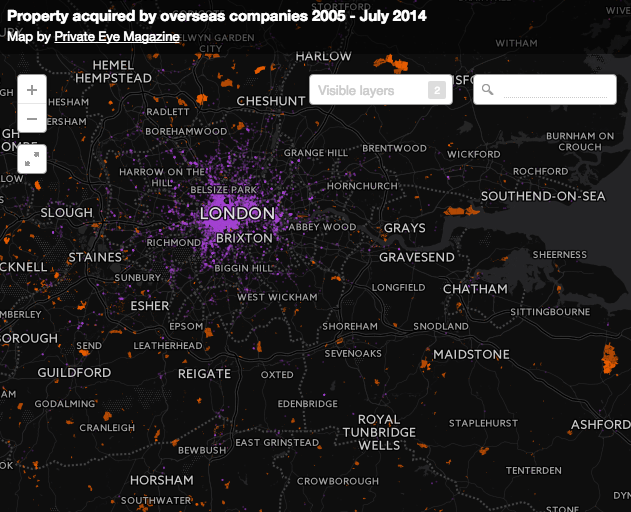
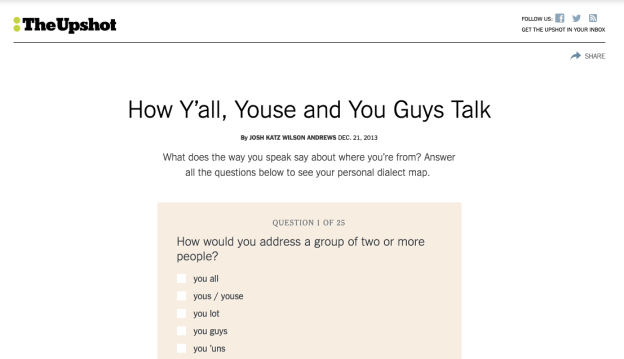
- Interactive stories characterised by an explicit ‘call to action’ like “explore”, “play” or “Take the quiz” — or a more implicit invitation to users to explore what has been “Mapped” or “Every X that ever happened”; and
- Exploratory features that raise (and then answer) a question. These features often combine more than one of the first three angles (scale, change, ranking) or apply the angle to more than one measure or category. The key quality is that the core angle of the feature is ‘we explore’ multiple aspects rather than ‘we reveal the scale/rank/change’ of one main thing.