
A year and a day ago (which is slightly eerie) I wrote about how one Mexican blogger had used Benford’s Law to spot some unreliable data on drug-related murders being used by the UN and Mexican police.
On Sunday Jialan Wang used the same technique to look at US accounting data on over 20,000 firms – and found that over the last few decades the data has become increasingly unreliable.
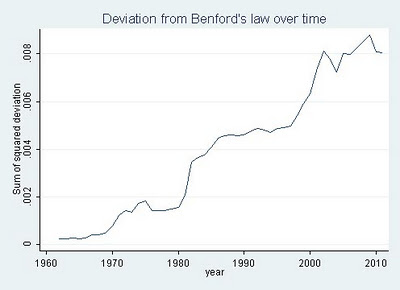
“According to Benford’s law,” she wrote, “accounting statements are getting less and less representative of what’s really going on inside of companies. The major reform that was passed after Enron and other major accounting standards barely made a dent.”
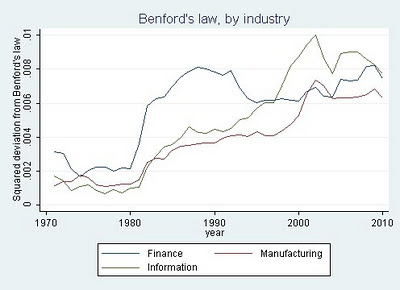
She then drilled down into three industries: finance, information technology, and manufacturing, and here’s where it gets even more interesting.
“The finance industry showed a huge surge in the deviation from Benford’s from 1981-82, coincident with two major deregulatory acts that sparked the beginnings of that other big mortgage debacle, the Savings and Loan Crisis. The deviation from Benford’s in the finance industry reached a peak in 1988 and then decreased starting in 1993 at the tail end of the S&L fraud wave, not matching its 1988 level until … 2008.”
She continues:
“The time series for information technology is similarly tied to that industry’s big debacle, the dotcom bubble. Neither manufacturing nor IT showed the huge increase and decline of the deviation from Benford’s that finance experienced in the 1980s and early 1990s, further validating the measure since neither industry experienced major fraud scandals during that period. The deviation for IT streaked up between 1998-2002 exactly during the dotcom bubble, and manufacturing experienced a more muted increase during the same period.”
“Deviations from Benford’s law are [here] compellingly correlated with known financial crises, bubbles, and fraud waves. And overall, the picture looks grim. Accounting data seem to be less and less related to the natural data-generating process that governs everything from rivers to molecules to cities. Since these data form the basis of most of our research in finance, Benford’s law casts serious doubt on the reliability of our results. And it’s just one more reason for investors to beware.”
I love this sort of stuff, because it highlights how important it is for us to question data just as much as we question any other source, while showing just how that can be done.
It also highlights just how central that data often is to key decisions that we and our governments make. Indeed, you might suggest that financial journalists should be doing this sort of stuff routinely if they want to avoid being caught out by the next financial crisis. Oh, as well as environment reporters and crime correspondents.

So having identified Benford’s Law as an analytical technique that we can use as a way of gaining confidence, or not, in a dataset, the next question is: how do I apply it?
This post – http://www.decisionsciencenews.com/2011/10/05/do-cents-follow-benfords-law/ – includes a couple of methods (one using R, one using a Unix command-line tool), which can maybe represent a starting point for bootstrapping up from ‘some programming required” to ‘click here to run Benford’s law test’?
PS to previous comment – the actual use case I linked to is *not* a good example when it comes to actually checking data against Benford’s Law. Benford’s Law applies when the data spans several orders of magnitude (tens, hundreds, thousands, tens of thousands, etc) not, as in the example i linked to, a single decade. The test probably be more appropriate when applied to eg leading digits in local council expenses, where invoices ranging from 10s of pounds to millions of pounds might be expected.
Thanks Tony – both comments very helpful. Also spotted your tweet about the idea of a Google Refine functionality to do this. There are plugins for Refine so someone could write one…
Pingback: A magical fraud finder « magic dashboards
Pingback: When data goes bad | Online Journalism Blog