
Maria Crosas Batista highlights ways to get started with adding interactivity to your journalism.
This post is for beginners that are learning HTML, CSS and JavaScript. Below are 3 useful websites to embed maps, charts and timelines in your HTML without going crazy.
Note that these techniques will only work on webpages where you have access to the full HTML, not pages hosted on blogging platforms such as WordPress.com or Medium.
To show both the code and the resulting webpage in the screenshots below I have used Codepen, an online code editor which allows you to get a real-time preview of your code.
1. Mapbox
Mapbox allows you to import a map into your code and change features using CSS:
Step 1: Go to the ‘Developers’ section and click on the ‘Mapbox JS’.
Step 2: Import the libraries to your HTML header:

Step 3: Copy the text between the script tags:

Step 4: Paste the code into the HTML of your page between <script> tags, or linked JavaScript file.

If you want to focus the map on a particular location, you will need to get the latitude and longitude of that location. Read this previous post on Dinfografia if you need to know how to do that.
Step 5: With the lat/long you can now zoom and focus the map on a particular area:

Step 6: Mapbox also gives you the code to add features such as markers, circles, icons, etc.

2. Chartist
It allows you to embed interactive charts, change their features and graphic forms or add information.
1. Import the library to your HTML header.
Look for the ‘Getting started‘ section and find the ‘One, Two, Three, CSS!’ title. Click on the ‘Show CDN code’ and copy the script code between the quotation marks:

Copy: //cdn.jsdelivr.net/chartist.js/latest/chartist.min.css
2. Jump into the ‘As simple as it can get’ section so you don’t need to download and install anything on your computer.
3. Copy the <div> code and insert it into your HTML body document:

4. Copy the data related to the chart and paste it within the Javascript section:
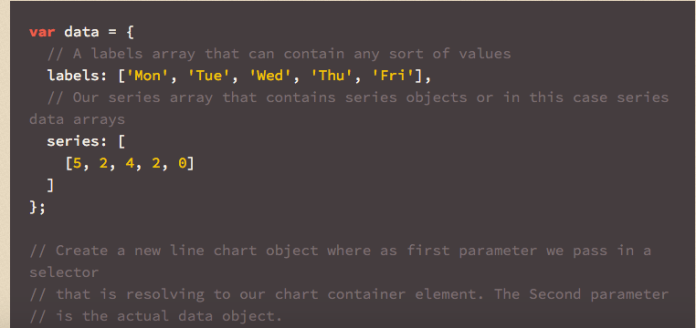
5. This chart can be personalised adding more numbers, changing colours, transform it into a different graphic form…

3. Timeline JS
Step 1: Use their spreadsheet template to copy your data.

Step 2: Introduce your data. I’ve put random text, numbers and pictures to use it as an example:

Step 3: Publish this spreadsheet and copy the link:

Copy the link in the centre of the document
Step 4: Paste the link into the TimlineJS website and make any changes related to the language, font, etc:

Paste the Google Spreadsheet URL
Step 5: Get the embed code:
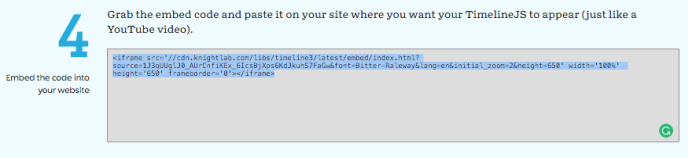
- Paste the code into your HTML section to see the visualisation:

Do you have any other examples? Let me know in the comments.

Pingback: Just add JavaScript: use these 3 tools to get instant interactivity | Online Journalism Blog | do not drop the ball