Author Archives: Paul Bradshaw

How do you cost your work as a freelance multimedia/data/community journalist? 3 questions to ask

Money and dice on scales

Dice and Money on Scales image by Images Money

Costing up your work as a freelance in multimedia, liveblogging, data journalism, community management or SEO isn’t straightforward. There’s no simple answer to ‘How much should I charge for this particular work?’ because the field isn’t standardised enough to have reliable rates.

But there are three questions you can ask yourself which can help you set a price or feel comfortable with the decision you make about taking or turning down work.

Question 1: What are your costs?

The basic cost is your time. How much time do you realistically think the work will take? And how much do you value that time, e.g. per hour? Journalism often takes more time than anticipated: contacts take more chasing; case studies fall through. Editors ask for new versions.

Travel is another cost, and accommodation and food for some work too. It may be worth negotiating on these costs separately, rather than including it in the fee, so the two can be distinguished.

Then there are equipment costs if you are working in multimedia. These are generally not specific to the project so shouldn’t have a big impact – but they do have an impact on question 3 below.

Question 2: What value does the work add to you?

How much value do you get from the work, for example:

  • Will it add to your CV in areas that it lacks (rather than areas you already have)?
  • Will it build your reputation?
  • Does it give you an opportunity to learn new skills that you couldn’t learn otherwise?
  • Does it give you an opportunity to meet people or gain access to places you wouldn’t otherwise – and what will add value to you in some way?

Question 3: What supply and demand exists for your skills?

Like any market, prices in journalism are significantly shaped by supply and demand.

For example, if there are very few people offering the skills that you have, and – crucially – a lot of clients demanding your skills, then you can ask for more.


Multimedia is one area where an investment in equipment can narrow the pool of those able to offer similar services – but not always.

It should be a judgement based on experience, not ego. You may think your skills are valuable, but if you’re not getting a lot of approaches for work then the demand is not there at this time. But if you’re getting more offers than you have time to do, then try increasing your price.

If the market is flooded by people with particular skills, prices drop. This is why freelance print journalism is so poorly paid: work that might take you two weeks to produce might only command £100, or £50, or zero, because there are enough people competing to do it for that price.

But it’s worth remembering that they might be competing to do it for that price because they a) think it will take them less time than you (rightly or wrongly); and/or b) get more value from the work than you. In other words, they have different answers to questions 1 and 2 above.

Upping the price: gathering an evidence base

One of the reasons why you may be offered less money than you expect is because publishers often don’t know the value of content themselves. Liveblogging, multimedia, and other new formats are still establishing their worth, while journalism as a whole continues to depreciate.

So collect evidence on effectiveness and make a case for the value your work has.

For example, liveblogging is known to drive traffic; there is evidence that data journalism tends to have much higher dwell times than other journalism. Multimedia generates higher engagement metrics. Good community management can increase conversion rates.

video-viewing-length-by-device-2012-ooyala

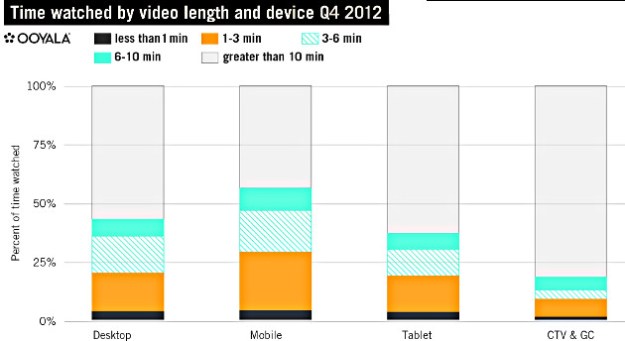
Showing the value of longform video – image from Ooyala 2012 end of year index report


Simple tools like bit.ly allow you to measure things like clickthrough on links; asking for analytics from employers – or even negotiating extra payments based on performance can encourage clients to look at metrics they might otherwise be ignorant of.

Do you have any other factors you consider when pricing up work? 

Guest post: How I did it – visualising carpooling patterns in Germany

Visualising carpool data

In a guest post for OJB, Natalia Karbasova explains how, with no coding experience, she used German carpool data for the basis of a data visualisation project.

Some time ago I was working on a new blog on the sharing economy, lets-share.de. It was high time to add some data-driven stories visualising important issues of the sharing economy, which change our lives.

Mitfahrgelegenheit.de is the popular German version of Carpooling.com. I decided to create a visualization which would show carpooling patterns between cities in Germany and, possibly, reveal hidden connections. Continue reading

Crowdfunding: what are you paying for?

Few examples illustrate the complexities of crowdfunding better than Shane Bauer‘s Beacon page to crowdfund $75,000 for a year-long investigation into US prisons. It includes a number of options for “backing” Bauer (a usefully generic term) which fall into 3 broad categories and are worth learning from:

1. Are you paying for content?

crowdfunding subscriptions on Beacon

The most obvious thing to charge for in a crowdfunding operation is content. And so, the most basic options in Bauer’s project (and in most Beacon projects) are subscriptions: monthly, six-monthly, and annual. Continue reading

My next ebook: Finding Stories in Spreadsheets

Finding Stories In Spreadsheets ebook cover

In a few weeks I will begin publishing my new ebook: Finding Stories In Spreadsheets.

The book has been written in response to requests from journalists who need a book on Excel aimed at storytellers, not accountants.

Finding Stories In Spreadsheets will outline a range of techniques, including ways to find the ‘needle in the haystack’ in text data, number calculations to make stories clearer, and methods of cleaning and combining data to tell new stories, including getting data ready for maps and charts.

The book will be available for a discounted rate for the first couple of weeks. To be informed when it’s available, register your interest on the Leanpub page.

Fund an investigative project – and get analytics for free?

Lyra McKee is a brave young woman. Not (just) because of her investigation into the murder of a Northern Ireland politician – but because of her decision this week to offer supporters access to the metrics behind it.

Many journalists would find such an idea terrifying: telling everyone how many people are reading my work? Sharing it? Finishing it? There’s simply too much to lose. “Pay no attention to that man behind the curtain.”

But crowdfunding creates a different dynamic. When I backed SA Mathieson‘s project on Beacon, I wasn’t buying content: I was supporting something I believed in. I was supporting a writer to spend time on one topic.

Notably, Beacon’s own strategy acknowledges this: there is no way to subscribe to the ‘brand’ of Beacon – to get access to all content you must support one specific project. Continue reading

“I don’t do maths”: how j-schools teach statistics to journalists

stats Image by Simon Cunningham

Image by Simon Cunningham

Teresa Jolley reports from a conference for teaching statistics to journalism students

I am not a great ‘numbers’ person, but even I was surprised by the attitudes that journalism lecturers at the Statistics in Journalism conference reported in their students.

‘I don’t do numbers’ and ‘I hate maths’ were depressingly common expressions, perhaps unsurprisingly. People wanting to study journalism enjoy the use of language and rarely expect that numbers will be vital to the stories they are telling.

So those responsible for journalism education have a tricky task. A bit like providing a sweet covering to a nasty-tasting tablet, it was said that lecturers need to be adept at finding ingenious ways to teach a practical and relevant use of numbers without ever mentioning the M (maths) or S (statistics) words. Continue reading

That massive open online course on data journalism now has a start date

In case you haven’t seen the tweets and blog posts, that MOOC on data journalism I’m involved in has a start date: May 19.

The launch was delayed a little due to the amount of people who signed up – which I think was a sensible decision.

You can watch the introduction video above, or ‘meet the instructors’ below. Looking forward to this…

Art or journalism?

The internet has opened up all sorts of creative possibilities for journalists – and artists. The following is just a selection of examples of both – but which is journalism, and which is art?

The gentrification of New York shown through a series of images:

condo

A map of cannabis outlets:

cannabis map

The strangest Facebook Graph searches: Continue reading

Why open data matters – a (very bad) example from Universal Jobmatch

Open Data stickers image by Jonathan Gray

Open Data stickers image by Jonathan Gray

I come upon examples of bad practice in publishing government data on a regular basis, but the Universal Jobmatch tool is an example so bad I just had to write about it. In fact, it’s worse than the old-fashioned data service that preceded it.

That older service was the Office for National Statistics’ labour market service NOMIS, which published data on Jobcentre vacancies and claimants until late 2012, when Jobcentre Plus was given responsibility for publishing the data using their Universal Jobmatch tool.

Despite a number of concerns, more than a year on, Universal Jobmatch‘s reports section has ignored at least half of the public data principles first drafted by the Government’s Public Sector Transparency Board in 2010, and published in 2012. Continue reading

How hashtags made puns acceptable in SEO

For some time now basic SEO advice on puns has been simple: don’t do it*.

But the Huffington Post story below (brought to my attention by Christina Kenny) shows how hashtags can make puns SEO-friendly as well – as long as they’ve been adopted by a larger audience, not just coined by the headline writer.

That headline: #Poonami Flows Through Kennington, South London After Sewage Pipe Burst (PICTURES)

That headline actually has 7 keywords in total – it’s extremely heavily SEO’d for people searching for “sewage pipe burst” and “Kennington” or “South London”.

But it also recognises that many people will be searching for more on this story having seen the #poonami hashtag on Twitter. Continue reading