Tag Archives: fusion tables

When to use shape maps in data visualisation: part 2 of a great big guide

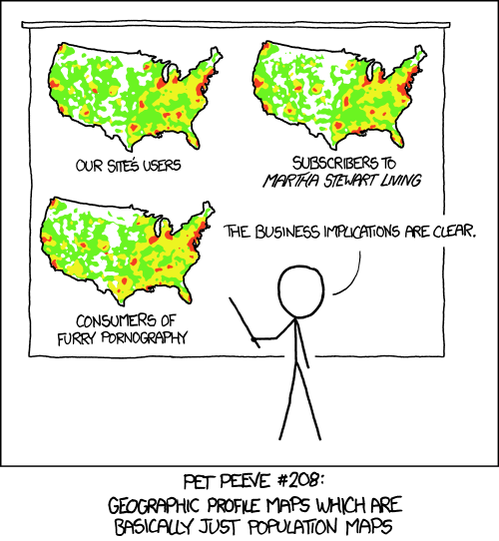
maps xkcd

xkcd’s take on mapping, via Duarte Romero

In a previous post I explained some of the considerations in deciding to use a map in data visualisation, and went into detail about mapping points and heatmaps. In this second part, taken from the MA in Online Journalism at Birmingham City University, I’m going to look at other types of maps: shape-based maps and image maps.

Mapping shapes

A more ambitious alternative to mapping points is to map shapes: in other words, instead of each data point being placed on a specific point on a map, instead different areas on that map are drawn and coloured/labelled according to the relevant data. Continue reading

Guest post: 10 lessons from data journalism training

Following my post on data journalism teaching fellow trainer Peter Verweij got in touch to share a post which first appeared on his blog earlier this month. I’m reproducing it here with permission. A Dutch version is also available here. Continue reading

2 how-tos: researching people and mapping planning applications

Mapping planning applications

Sid Ryan’s planning applications map

Sid Ryan wanted to see if planning applications near planning committee members were more or less likely to be accepted. In two guest posts on Help Me Investigate he shows how to research people online (in this case the councillors), and how to map planning applications to identify potential relationships.

The posts take in a range of techniques including:

  • Scraping using Scraperwiki and the Google Drive spreadsheet function importXML
  • Mapping in Google Fusion Tables
  • Registers of interests
  • Using advanced search techniques
  • Using Land Registry enquiries
  • Using Companies House and Duedil
  • Other ways to find information on individuals, such as Hansard, LinkedIn, 192.com, Lexis Nexis, whois and FriendsReunited

If you find it useful, please let me know – and if you can add anything… please do.

Data visualisation training

If you’re interested in data visualisation I’m delivering a training course on November 7 with the excellent Caroline Beavon. Here’s what we’re covering:

  • Pick the right chart for your story – against a deadline
  • Mapping tricks and techniques: using Fusion Tables and other tools to map Olympic torchbearers
  • Picking the right data to visualise
  • Visualisation tips for free chart tools
  • Avoiding common visualisation mistakes
  • Create an infographic with Tableau and Illustrator
  • Making data interactive

More details here. Places can be booked here.

Create a council ward map with Scraperwiki

Mapping council wards

With local elections looming this is a great 20-30 minute project for any journalist wanting to create an interactive Google map of council ward boundaries.

For this you will need:

How to: convert easting/northing into lat/long for an interactive map

A map generated in Google Fusion Tables from a geocoded dataset
A map generated in Google Fusion Tables from a dataset cleaned using these methods

Google Fusion Tables is great for creating interactive maps from a spreadsheet – but it isn’t too keen on easting and northing. That can be a problem as many government and local authority datasets use easting and northing to describe the geographical position of things – for example, speed cameras.

So you’ll need a way to convert easting and northing into something that Fusion Tables does like – such as latitude and longitude.

Here’s how I did it – quickly. Continue reading

How to: convert easting/northing into lat/long for an interactive map

A map generated in Google Fusion Tables from a geocoded dataset

A map generated in Google Fusion Tables from a dataset cleaned using these methods

Google Fusion Tables is great for creating interactive maps from a spreadsheet – but it isn’t too keen on easting and northing. That can be a problem as many government and local authority datasets use easting and northing to describe the geographical position of things – for example, speed cameras.

So you’ll need a way to convert easting and northing into something that Fusion Tables does like – such as latitude and longitude.

Here’s how I did it – quickly. Continue reading

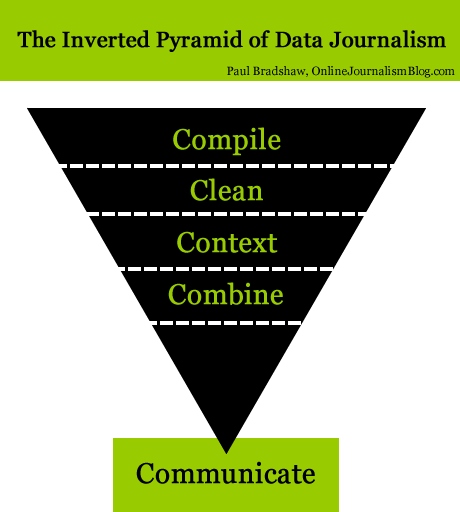
The inverted pyramid of data journalism

I’ve been working for some time on picking apart the many processes which make up what we call data journalism. Indeed, if you read the chapter on data journalism (blogged draft) in my Online Journalism Handbook, or seen me speak on the subject, you’ll have seen my previous diagram that tries to explain those processes.

I’ve now revised that considerably, and what I’ve come up with bears some explanation. I’ve cheekily called it the inverted pyramid of data journalism, partly because it begins with a large amount of information which becomes increasingly focused as you drill down into it until you reach the point of communicating the results.

What’s more, I’ve also sketched out a second diagram that breaks down how data journalism stories are communicated – an area which I think has so far not been very widely explored. But that’s for a future post.

I’m hoping this will be helpful to those trying to get to grips with data, whether as journalists, developers or designers. This is, as always, work in progress so let me know if you think I’ve missed anything or if things might be better explained.

UPDATE: Also in Spanish.

The inverted pyramid of data journalism

Inverted pyramid of data journalism

Here are the stages explained: Continue reading