
Once upon a time Audit Scotland published performance data for every council in Scotland. The approach was simple: a spreadsheet for every council with dozens of indicators across several pages.
Audit Scotland data from 2012/13
As far as open data goes it wasn’t ideal: comparing councils involved manually downloading spreadsheets and combining them, unless you wrote a scraper to do that for you. Which is what I did last year while working with the Sunday Post on a series of stories.
But at least you had the data in some sort of raw format.
If you look for the data this year, however, you will find things a little more complicated:
“The local government community now produce council performance information through the Local Government Benchmarking Framework.”
Now there’s a middleman. And here things start to go downhill (before a happy ending).
If you go to the Local Government Benchmarking Framework and click ‘Explore the data’ you’ll find yourself presented not with data, but a drop-down menu:

Explore the data? Only how we want you to
Here’s the first problem: click on a particular council and click ‘Go’ and you’ll be taken to a page with the same URL as the previous page.
Worse, users are then asked to select which theme they want to explore (for example, children’s or environmental services), and then within that which measure you want to look at. All of these have the same URL – and no link to the actual figures they are based on.
Why unique URLs and downloads are part of government guidance on open data
All of which breaks the public data principles laid out by the Public Sector Transparency Board:
“Public data will be published in re-usable, machine-readable form”.
Unique URLs for data, and a link to the data itself rather than a chart representing it, are pretty basic qualities of open data.

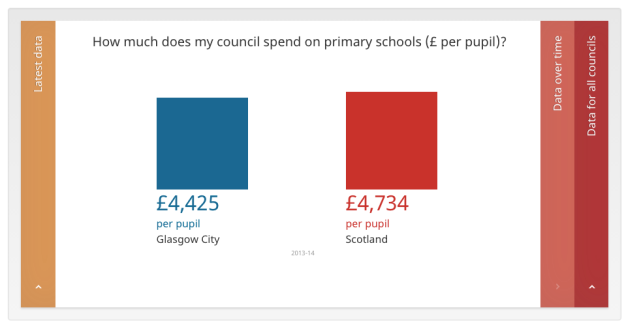
The Local Government Benchmarking Framework only allows you to compare one measure at a time – and only with the national average
The result is that users are severely limited in what they can do with the tool. If you want to compare Glasgow with Edinburgh, tough luck: this tool will only allow you to compare either to the national average.
If you want to compare how much schools spend on pre-school education per pupil with how much they spend on primary schools, that’s tough too.
You can only look at one measure at a time.
Data portals like this are supposed to reduce the number of FOI requests that authorities receive, and at this point you may be thinking that FOI is the only way to get hold of the raw data. But there’s another problem there…
Claiming copyright over public data
That problem comes at the foot of the page:

Two copyright notices suggest that users cannot re-use this data, breaking guidelines on public data
There are two separate assertions of copyright over the data being presented: one by the Improvement Service and another by Data Unit Wales. Data Unit Wales is a limited company. So is the Improvement Service.
Private companies are not normally covered by the FOI Act – and you might stop there. But the definition of a public authority now also covers companies which are wholly owned by the public sector.
Digging into ownership
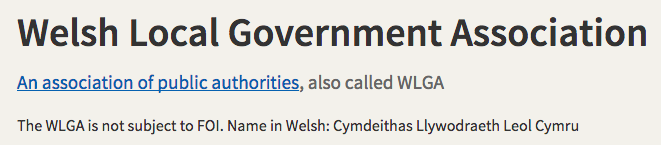
Data Unit Wales is a “Welsh local government company” based at Local Government House in Cardiff. Digging into their accounts you will find it is a subsidiary of the Welsh Local Government Association (WLGA).
 The WLGA is not subject to FOI…
 …but does that ownership mean that Data Unit Wales is subject to FOI? Either way, you can expect them to argue that they are not. Especially given that the WLGA have been critical of FOI.
The Improvement Service, meanwhile, is a partnership between the Convention of Scottish Local Authorities (COSLA) and the Society of Local Authority Chief Executives. These are similar bodies again (the Campaign for Freedom of Information has asked for FOI to be extended to COSLA), raising similar issues.
More broadly, there are questions to be asked about why the publication of public data is being organised by private companies wholly owned by bodies publicly opposed to transparency, and not subject to scrutiny themselves.
Going direct to the councils
Back to the Local Government Benchmarking Framework too. How about clicking on ‘More information’?
“Each council in Scotland publishes further details about their own performance in their Public Performance Reporting which can be found on your councils’ website.”
Click on that link and you get a list of councils. Click on one of those and you get…
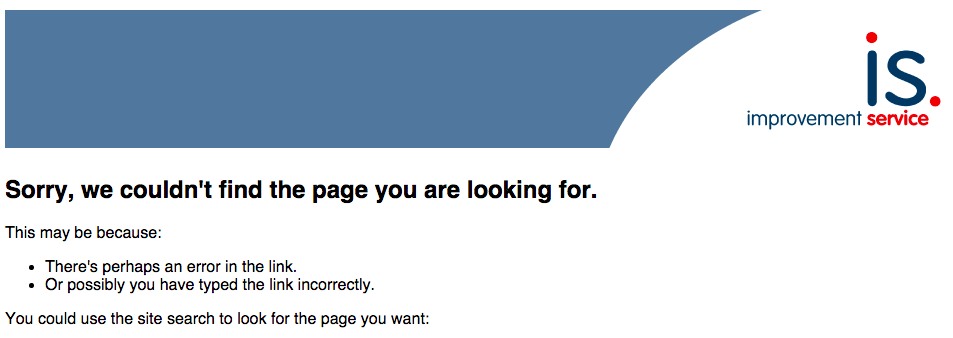 Oh dear.
Glasgow has its own open data problem
There is another ‘Council Links’ page here, which takes you out to individual council websites. Here there’s a mixed bag: some publish PDFs, others link back to the Framework site. Go to Glasgow’s page, however, and you get a whole other level of closed data:

Glasgow’s data is presented as a chart with an export option in a proprietary format
Is that a download option? Let’s find out.
 DXP file? It’s a proprietary format. To use it you’ll need…
 So much for “Public data will be published using open standards“.
The happy ending
I said this story had a happy ending, and here it is. You can find the raw data – but only if you look very, very deeply and click a lot of buttons.
Back on the Framework site there is an option to look at ‘Data by indicator‘. Click on one of the service areas (housing, adult social care, and so on) and you’ll be presented with a table showing averages for Scotland as a whole over the past few years.
But scroll down and you’ll see a list of indicators within that measure.
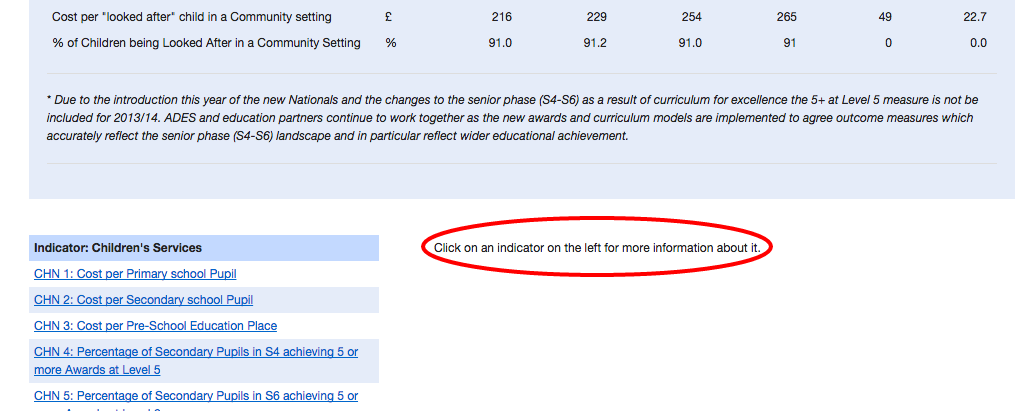 Click on one of those and you’ll get more information – including a data link!

Incredibly, this page uses frames – a web design approach which was abandoned over a decade ago. Here’s Jakob Nielsen explaining why in 1996
And here is the data!
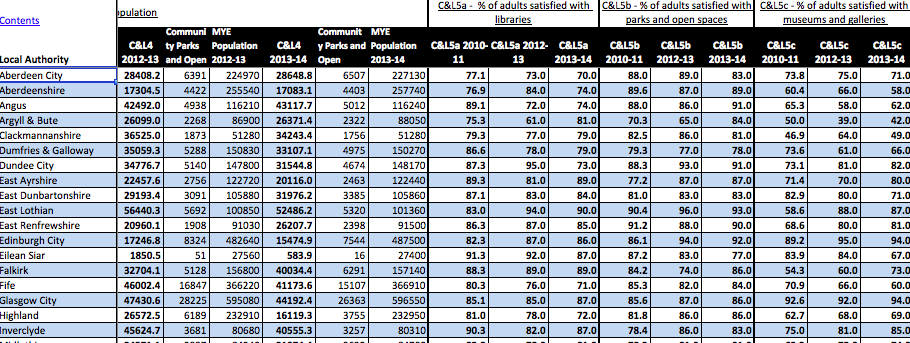 The data, in fact, covers all the measures – in every service area. As far as I can tell you will get the same spreadsheet whichever indicator you click. This contains the following:
- a contents sheet;
- a second sheet with indicators for children, corporate, social work and culture and leisure;
- a third sheet with indicators for environment, housing and economic development;
- and a final sheet to help you decipher the various acronyms being used for each indicator
Why does this data not have its own URL? Why is there no clear link for users to find it? Your guess is as good as mine. But now you know where it is.
