Tag Archives: scotland

I’m organising a data journalism conference – you should come

Data Journalism UK 2016In just over 4 weeks I’ll be holding a day of workshops and industry panels for aspiring and working data journalists across the UK. Want to come?

Data Journalism UK 2016, in Birmingham on November 22, will be focusing on the latest wave of regional data journalism projects, from the data journalists at Trinity Mirror and BBC Scotland to startups like Northern Ireland’s The Detail and winners of Google Digital News Initiative funding Talk About Local’s News Engine and the Bureau of Investigative Journalism.

I’m particularly pleased to have one of the most experienced data journalists in the country, Claire Miller, speaking too.

claire-miller

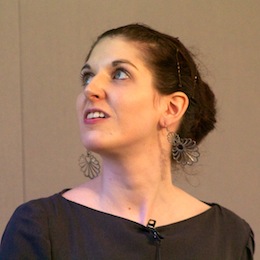
Claire Miller, author of the book Getting Started with Data Journalism

The event will mix industry speakers and experts with practical sessions: there’ll be drop-in sessions on getting started with data journalism, an information security ‘surgery’, and some speakers have been asked to focus on practical skills too.

On top of all that, attendees will have the opportunity to nominate skills they want to learn – we’ll put on workshops for the most popular topics!

You can sign up for the event here, and tell me what sessions you want covered on Twitter @paulbradshaw

The event is being jointly sponsored by the University of Stirling and Birmingham City University.

Comparison chart between Glasgow and national average

How Scotland made its council audit data less open (with happy ending)

Once upon a time Audit Scotland published performance data for every council in Scotland. The approach was simple: a spreadsheet for every council with dozens of indicators across several pages.

audit scotland data

Audit Scotland data from 2012/13

As far as open data goes it wasn’t ideal: comparing councils involved manually downloading spreadsheets and combining them, unless you wrote a scraper to do that for you. Which is what I did last year while working with the Sunday Post on a series of stories.

But at least you had the data in some sort of raw format.

If you look for the data this year, however, you will find things a little more complicated:

“The local government community now produce council performance information through the Local Government Benchmarking Framework.”

Now there’s a middleman. And here things start to go downhill (before a happy ending). Continue reading

Playing with heat-mapping UK data on OpenHeatMap

heat mapping test />

Last night OpenHeatMap creator Pete Warden announced that the tool now allowed you to visualise UK data. I’ve been gleefully playing with the heat-mapping tool today and thought I’d share some pointers on visualising data on a map.

This is not a tutorial for OpenHeatMap – Pete’s done a great job of that himself (video below) – but rather an outline of the steps to get some map-ready data in the first place. Continue reading