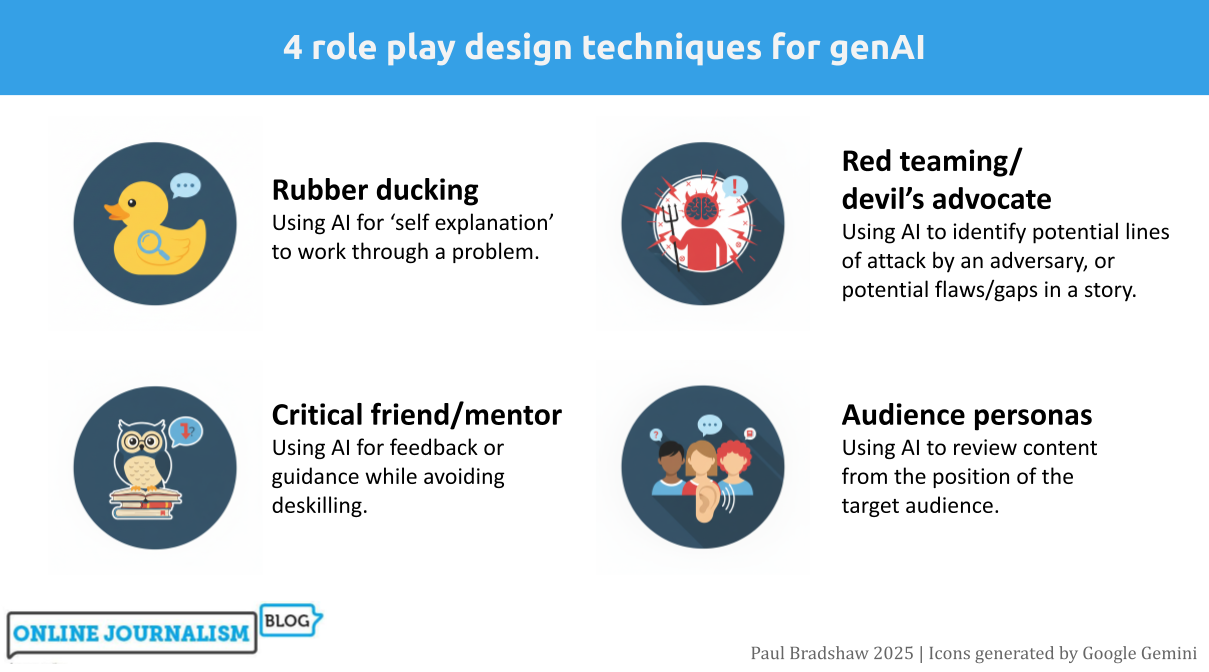
One of the most productive ways of using generative AI tools is role playing: asking Copilot or ChatGPT etc. to adopt a persona in order to work through a scenario or problem. In this post I work through four of the most useful role playing techniques for journalists: “rubber ducking”, mentoring, “red teaming” and audience personas, and identify key techniques for each.
Role playing sits in a particularly good position when it comes to AI’s strengths and weaknesses. It plays to the strengths of AI around counter-balancing human cognitive biases and ‘holding up a mirror’ to workflows and content — and scores low on most measures of risk in using AI, being neither audience-facing nor requiring high accuracy.
When you have a hammer does everything look like a nail? Photo by Hunter Haley on Unsplash
TL;DR: By treating AI as a biased actor rather than a tool shaped by human choices, we risk ignoring more fundamental sources of bias within journalism itself. Editorial independence lies in how we manage tools, not which ones we use.
Might AI challenge editorial independence? It’s a suggestion made in some guidance on AI — and I think a flawed one.
Why? Let me count the ways. The first problem is that it contributes to a misunderstanding of how AI works. The second is that it reinforces a potentially superficial understanding of editorial independence and objectivity. But the main danger is it distracts from the broader problems of bias and independence in our own newsrooms.
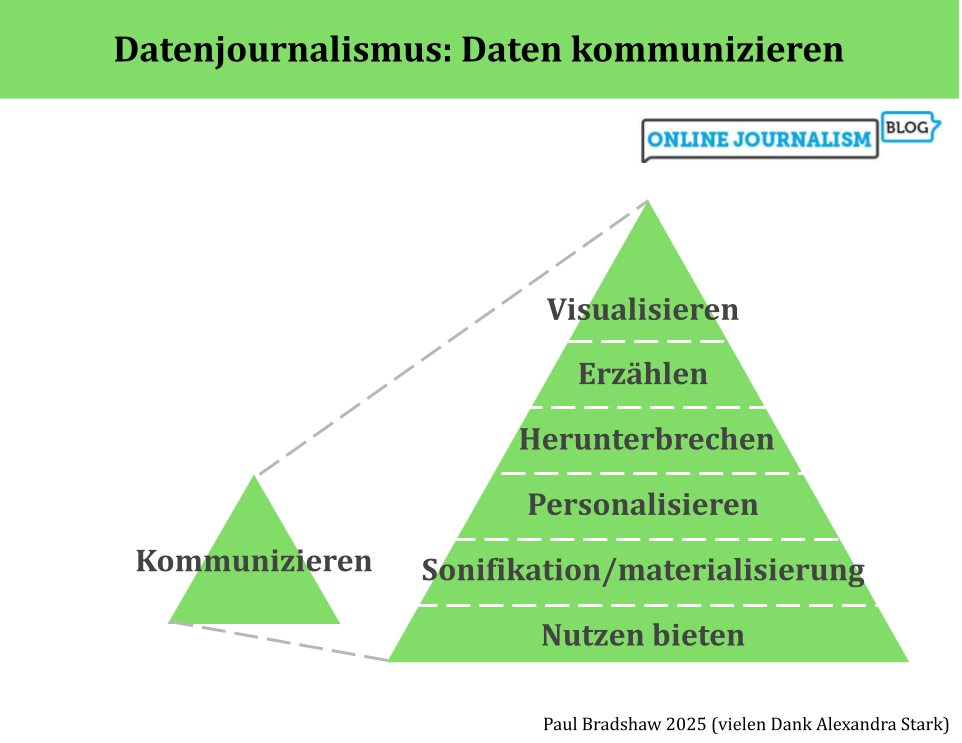
Die umgekehrte Pyramide des Datenjournalismus bildet den Prozess der Datennutzung in der Berichterstattung ab, von der Ideenentwicklung über die Bereinigung, Kontextualisierung und Kombination bis hin zur Kommunikation. In dieser letzten Phase – der Kommunikation – sollten wir einen Schritt zurücktreten und unsere Optionen betrachten: von Visualisierung und Erzählung bis hin zu Personalisierung und Werkzeugen.
Visualisierung kann ein schneller Weg sein, die Ergebnisse des Datenjournalismus zu vermitteln: Kostenlose Tools wie Datawrapper und Flourish erfordern oft nur, dass du deinen Daten hochlädst und aus verschiedenen Visualisierungsoptionen auswählst.
If you’ve been working on a story involving data, the temptation can be to throw all the figures you’ve found into the resulting report — but the same rules of good writing apply to numbers too. Here are some tips to make sure you’re putting the story first.
In a previous post I explored how AI performed on data analysis tasks — and the importance of understanding the code that it used to do so. If you do understand code, here are some tips for using large language models (LLMs) for analysis — and addressing the risks of doing so.
TL;DR: If you understand code, or would like to understand code, genAI tools can be a useful tool for data analysis — but results depend heavily on the context you provide, and the likelihood of flawed calculations mean code needs checking. If you don’t understand code (and don’t want to) — don’t do data analysis with AI.
ChatGPT used to be notoriously bad at maths. Then it got worse at maths. And the recent launch of its newest model, GPT-5, showed that it’s still bad at maths. So when it comes to using AI for data analysis, it’s going to mess up, right?
Well, it turns out that the answer isn’t that simple. And the reason why it’s not simple is important to explain up front.
But over the last two years AI platforms have added the ability to generate and run code (mainly Python) in response to a question. This means that, for some questions, they will try to predict the code that a human would probably write to solve your question — and then run that code.
When it comes to data analysis, this has two major implications:
Responses to data analysis questions are often (but not always) the result of calculations, rather than a predicted sequence of words. The algorithm generates code, runs that code to calculate a result, then incorporates that result into a sentence.
Because we can see the code that performed the calculations, it is possible to checkhow those results were arrived at.
I et tidligere innlegg skrev jeg om fire av vinklene som oftest brukes til å fortelle historier om data. I denne andre delen ser jeg på de tre øvrige vinklene: historier som fokuserer på sammenhenger; ‘metadata’-vinkler som fokuserer på dataenes fravær, dårlige kvalitet eller innsamling — og utforskende artikler som blander flere vinkler eller gir en mulighet til å bli kjent med selve dataene.
What if we just asked students to keep a record of all their interactions with AI? That was the thinking behind the AI diary, a form of assessment that I introduced this year for two key reasons: to increase transparency about the use of AI, and to increase critical thinking.
One of the biggest concerns over the use of generative AI tools like ChatGPT is their environmental impact. But what is that impact — and what strategies are there for reducing it? Here is what we know so far — and some suggestions for good practice.
What exactly is the environmental impact of using generative AI? It’s not an easy question to answer, as the MIT Technology Review’s James O’Donnell and Casey Crownhart found when they set out to find some answers.
“The common understanding of AI’s energy consumption,” they write, “is full of holes.”
Datenjournalistische Projekte lassen sich in einzelne Schritte aufteilen – jeder einzelne Schritt bringt eigene Herausforderungen. Um dir zu helfen, habe ich die “Umgekehrte Pyramide des Datenjournalismus” entwickelt. Sie zeigt, wie du aus einer Idee eine fokussierte Datengeschichte machst. Ich erkläre dir Schritt für Schritt, worauf du achten solltest, und gebe dir Tipps, wie du typische Stolpersteine vermeiden kannst.