Tag Archives: google refine

How to use the CableSearch API to quickly reference names against Wikileaks cables (SFTW)

Cablesearch logo

CableSearch is a neat project by the European Centre for Computer Assisted Research and VVOJ (the Dutch-Flemish association for investigative journalists) which aims to make it easier for journalists to interrogate the Wikileaks cables. Although it’s been around for some time, I’ve only just noticed the site’s API, so I thought I’d show how such an API can be useful as a way to draw on such data sources to complement data of your own. Continue reading

How to: convert easting/northing into lat/long for an interactive map

A map generated in Google Fusion Tables from a geocoded dataset
A map generated in Google Fusion Tables from a dataset cleaned using these methods

Google Fusion Tables is great for creating interactive maps from a spreadsheet – but it isn’t too keen on easting and northing. That can be a problem as many government and local authority datasets use easting and northing to describe the geographical position of things – for example, speed cameras.

So you’ll need a way to convert easting and northing into something that Fusion Tables does like – such as latitude and longitude.

Here’s how I did it – quickly. Continue reading

How to: convert easting/northing into lat/long for an interactive map

A map generated in Google Fusion Tables from a geocoded dataset

A map generated in Google Fusion Tables from a dataset cleaned using these methods

Google Fusion Tables is great for creating interactive maps from a spreadsheet – but it isn’t too keen on easting and northing. That can be a problem as many government and local authority datasets use easting and northing to describe the geographical position of things – for example, speed cameras.

So you’ll need a way to convert easting and northing into something that Fusion Tables does like – such as latitude and longitude.

Here’s how I did it – quickly. Continue reading

SFTW: How to grab useful political data with the They Work For You API

They Work For You

It’s been over 2 years since I stopped doing the ‘Something for the Weekend’ series. I thought I would revive it with a tutorial on They Work For You and Google Refine…


If you want to add political context to a spreadsheet – say you need to know what political parties a list of constituencies voted for, or the MPs for those constituencies – the They Work For You API can save you hours of fiddling – if you know how to use it. Continue reading

SFTW: How to grab useful political data with the They Work For You API

They Work For You

It’s been over 2 years since I stopped doing the ‘Something for the Weekend’ series. I thought I would revive it with a tutorial on They Work For You and Google Refine…

If you want to add political context to a spreadsheet – say you need to know what political parties a list of constituencies voted for, or the MPs for those constituencies – the They Work For You API can save you hours of fiddling – if you know how to use it.

An API is – for the purposes of journalists – a way of asking questions for reams of data. For example, you can use an API to ask “What constituency is each of these postcodes in?” or “When did these politicians enter office?” or even “Can you show me an image of these people?”

The They Work For You API will give answers to a range of UK political questions on subjects including Lords, MLAs (Members of the Legislative Assembly in Northern Ireland), MPs, MSPs (Members of the Scottish Parliament), select committees, debates, written answers, statements and constituencies.

When you combine that API with Google Refine you can fill a whole spreadsheet with additional political data, allowing you to answer questions you might otherwise not be able to.

I’ve written before on how to use Google Refine to pull data into a spreadsheet from the Google Maps API and the UK Postcodes API, but this post takes things a bit further because the They Work For You API requires something called a ‘key’. This is quite common with APIs so knowing how to use them is – well – key. If you need extra help, try those tutorials first. Continue reading

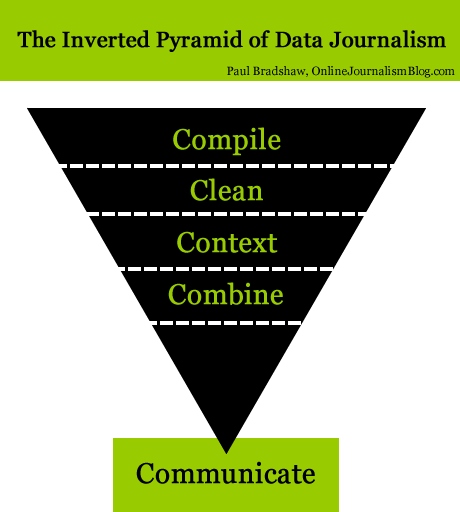
The inverted pyramid of data journalism

I’ve been working for some time on picking apart the many processes which make up what we call data journalism. Indeed, if you read the chapter on data journalism (blogged draft) in my Online Journalism Handbook, or seen me speak on the subject, you’ll have seen my previous diagram that tries to explain those processes.

I’ve now revised that considerably, and what I’ve come up with bears some explanation. I’ve cheekily called it the inverted pyramid of data journalism, partly because it begins with a large amount of information which becomes increasingly focused as you drill down into it until you reach the point of communicating the results.

What’s more, I’ve also sketched out a second diagram that breaks down how data journalism stories are communicated – an area which I think has so far not been very widely explored. But that’s for a future post.

I’m hoping this will be helpful to those trying to get to grips with data, whether as journalists, developers or designers. This is, as always, work in progress so let me know if you think I’ve missed anything or if things might be better explained.

UPDATE: Also in Spanish.

The inverted pyramid of data journalism

Inverted pyramid of data journalism

Here are the stages explained: Continue reading

Cleaning data using Google Refine: a quick guide

I’ve been focusing so much on blogging the bells and whistles stuff that Google Refine does that I’ve never actually written about its most simple function: cleaning data. So, here’s what it does and how to do it:

  1. Download and install Google Refine if you haven’t already done so. It’s free.
  2. Run it – it uses your default browser.
  3. In the ‘Create a new project’ window click on ‘Choose file‘ and find a spreadsheet you’re working with. If you need a sample dataset with typical ‘dirty data’ problems I’ve created one you can download here.
  4. Give it a project name and click ‘Create project‘. The spreadsheet should now open in Google Refine in the browser.
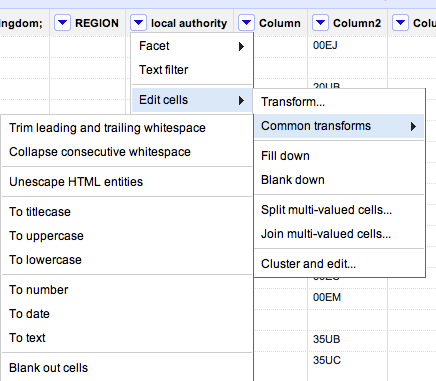
  5. At the top of each column you’ll see a downward-pointing triangle/arrow. Click on this and a drop-down menu opens with options including Facet; Text filter; Edit cells; and so on.
  6. Click on Edit cells and a further menu appears.
  7. The second option on this menu is Common transforms. Click on this and a final menu appears (see image below).

You’ll see there are a range of useful functions here to clean up your data and make sure it is consistent. Here’s why:

Trim leading and trailing whitespace

Sometimes in the process of entering data, people put a space before or after a name. You won’t be able to see it, but when it comes to counting how many times something is mentioned, or combining two sets of data, you will hit problems, because as far as a computer or spreadsheet is concerned, ” Jones” is different to “Jones”.

Clicking this option will remove those white spaces.

Collapse consecutive whitespace

Likewise, sometimes a double space will be used instead of a single space – accidentally or through habit, leading to more inconsistent data. This command solves that problem.

Unescape HTML entities

At some point in the process of being collected or published, HTML may be added to data. Typically this represents punctuation of some sort. “"” for example, is the HTML code for quotation marks. (List of this and others here).

This command will convert that cumbersome code into the characters they actually represent.

To titlecase/To uppercase/To lowercase

Another common problem with data is inconsistent formatting – occasionally someone will LEAVE THE CAPS LOCK ON or forget to capitalise a name.

This converts all cells in that column to be consistently formatted, one way or another.

To number/To date/To text

Like the almost-invisible spaces in data entry, sometimes a piece of data can look to you like a number, but actually be formatted as text. And like the invisible spaces, this becomes problematic when you are trying to combine, match up, or make calculations on different datasets.

This command solves that by ensuring that all entries in a particular column are formatted the same way.

Now, I’ve not used that command much and would be a bit careful – especially with dates, where UK and US formatting is different, for example. If  you’ve had experiences or tips on those lines let me know.

Other transforms

In addition to the commands listed above under ‘common transforms’ there are others on the ‘Edit cells’ menu that are also useful for cleaning data:

Split / Join multi-valued cells…

These are useful for getting names and addresses into a format consistent with other data – for example if you want to split an address into street name, city, postcode; or join a surname and forename into a full name.

Cluster and edit…

A particularly powerful cleaning function in Google Refine, this looks at your column data and suggests ‘clusters’ where entries are similar. You can then ask it to change those similar entries so that they have the same value.

There is more than one algorithm (shown in 2 drop-down menus: Method and Keying function) used to cluster – try each one in turn, as some pick up clusters that others miss.

If you have any other tips on cleaning data with Google Refine, please add them.

Merging Datasets with Common Columns in Google Refine

It’s an often encountered situation, but one that can be a pain to address – merging data from two sources around a common column. Here’s a way of doing it in Google Refine…

Here are a couple of example datasets to import into separate Google Refine projects if you want to play along, both courtesy of the Guardian data blog (pulled through the Google Spreadsheets to Yahoo pipes proxy mentioned here):

University fees data (CSV via pipes proxy)

University HESA stats, 2010 (CSV via pipes proxy)

We can now merge data from the two projects by creating a new column from values an existing column within one project that are used to index into a similar column in the other project. Looking at the two datasets, both HESA Code and institution/University look like candidates for merging the data. Which should we go with? I’d go with the unique identifier (i.e. HESA code in the case) every time…

First, create a new column:

Now do the merge, using the cell.cross GREL (Google Refine Expression Language) command. Trivially, and pinching wholesale from the documentation example, we might use the following command to bring in Average Teaching Score data from the second project into the first:

cell.cross("Merge Test B", "HESA code").cells["Average Teaching Score"].value[0]

Note that there is a null entry and an error entry. It’s possible to add a bit of logic to tidy things up a little:

if (value!='null',cell.cross("Merge Test B", "HESA code").cells["Average Teaching Score"].value[0],'')

Here’s the result:

Coping with not quite matching key columns

Another situation that often arises is that you have two columns that almost but don’t quite match. For example, this dataset has a different name representation that the above datasets (Merge Test C):

There are several text processing tools that we can use to try to help us match columns that differ in well-structured ways:

In the above case, where am I creating a new column based on the contents of the Institution column in Merge Test C, I’m using a couple of string processing tricks… The GREL expression may look complicated, but if you build it up in a stepwise fashion it makes more sense.

For example, the command replace(value,"this", "that") will replace occurrences of “this” in the string defined by value with “that”. If we replace “this” with an empty string (” (two single quotes next to each other) or “” (two double quotes next to each other)), we delete it from value: replace(value,"this", "")

The result of this operation can be embedded in another replace statement: replace(replace(value,"this", "that"),"that","the other"). In this case, the first replace will replace occurrences of “this” with “that”; the result of this operation is passed to the second (outer) replace function, which replaces “that” with “the other”). Try building up the expression in realtime, and see what happens. First use:
toLowercase(value)
(what happens?); then:
replace(toLowercase(value),'the','')
and then:
replace(replace(toLowercase(value),'the',''),'of','')

The fingerprint() function then separates out the individual words that are left, orders them, and returns the result (more detail). Can you see how this might be used to transform a column that originally contains “The University of Aberdeen” to “aberdeen university”, which might be a key in another project dataset?

When trying to reconcile data across two different datasets, you may find you need to try to minimise the distance between almost common key columns by creating new columns in each dataset using the above sorts of technique.

Be careful not to create false positive matches though; and also be mindful that not everything will necessarily match up (you may get empty cells when using cell.cross; (to mitigate this, filter rows using a crossed column to find ones where there was no match and see if you can correct them by hand). Even if you don’t completely successful cross data from one project to another, you might manage to automate the crossing of most of the rows, minimising the amount of hand crafted copying you might have to do to tidy up the real odds and ends…

So for example, here’s what I ended up using to create a “Pure key” column in Merge Test C:
fingerprint(replace(replace(replace(toLowercase(value),'the',''),'of',''),'university',''))

And in Merge Test A I create a “Complementary Key” column from the University column using fingerprint(value)

From the Complementary Key column in Merge Test A we call out to Merge Test C: cell.cross("Merge Test C", "Pure key").cells["UCAS ID"].value[0]

Obviously, this approach is far from ideal (and there may be more “correct” and/or efficient ways of doing this!) and the process described above is admittedly rather clunky, but it does start to reveal some of what’s involved in trying to bring data across to one Google Refine project from another using columns that don’t quite match in the original dataset, although they do (nominally) refer to the same thing, and does provide a useful introductory exercise to some of the really quite powerful text processing commands in Google Refine …