A map generated in Google Fusion Tables from a dataset cleaned using these methods
Google Fusion Tables is great for creating interactive maps from a spreadsheet – but it isn’t too keen on easting and northing. That can be a problem as many government and local authority datasets use easting and northing to describe the geographical position of things – for example, speed cameras.
So you’ll need a way to convert easting and northing into something that Fusion Tables does like – such as latitude and longitude.
One image from last night guaranteed not to have made it onto the front page - via Birmingham Riots 2011
It’s one thing to cover rioting on the doorstep of the national press – it’s quite another when squeezed regional newsrooms have to do the same. And as rioting in the UK spread from London to Birmingham and then other cities, some unlikely suspects showed how to cover a riot online even when you don’t have a newsroom.
Dominating online coverage in Birmingham was not a local newspaper or broadcaster but a Tumblr site – Birmingham Riots 2011 – set up by musician Casey Rain. Over dozens of entries Casey posted countless reports of what was taking place, and a range of photos and video footage which dwarfed the combined coverage of regional press and broadcast. Continue reading →
When we open-sourced the code for Help Me Investigate the plan was to move from a single site to a decentralised, networked structure. Now, thanks to Andy Dickinson, it has become even easier for anyone to host their own journalism crowdsourcing platform.
The plugin adds an ‘Investigations’ page to your self-hosted WordPress blog which holds ‘sticky’ pages for any investigations you want to pursue, and allows you to break those down into distinct challenges that anyone can contribute to.
Asking questions of a webpage – or find out when the answer changes
Despite its name, the =importXML formula can be used to grab information from HTML pages as well. This post on SEO Gadget, for example, gives a series of examples ranging from grabbing information on Twitter users to price information and web analytics (it also has some further guidance on using these techniques, and is well worth a read for that).
Asking questions of webpages typically requires more advanced use of XPath than I outlined previously – and more trial and error.
This is because, while XML is a language designed to provide structure around data, HTML – used as it is for a much wider range of purposes – isn’t quite so tidy.
Finding the structure
To illustrate how you can use =importXML to grab data from a webpage, I’m going to grab data from Gorkana, a job ads site.
If you look at their journalists jobs page, you’ll see all sorts of information, from navigation and ads to feeds and policies. This is how you could grab a specific piece of data from a page, and put it into a table structure, to answer any questions you might have:
Make a note of the first word or phrase in the section you want (e.g. “Senior account executive”) then right-click on the page and select View Source or whatever option allows you to see the HTML code behind the page.
You could scroll through this to try to find the bit you want, but it’s easier to use your search facility to find that key phrase you noted earlier (e.g. “Senior account executive”)
What you’re hoping to find is some sort of div class tag just above that key phrase – and in this case there’s one called div class=”jobWrap”
This means that the creator of the webpage has added some structure to it, wrapping all their job ads in that div.
We just need to write a formula that is equally specific.
Writing the formula
Open up a spreadsheet in Google Docs and write the following formula in cell B1:
When you press Enter you should see 3 columns filled with values from that particular part of the webpage: the job title; the package; and a brief description. Now that you have this data in a structured format you could, for example, work out average wages of job ads, or the most common job titles.
But how did that formula work? As I’ve explained most of =importXML in the previous post, I’ll just explain the query part here. So:
//div
is looking for a tag that begins
[starts-with
is specifying that the this div must begin in a particular way, and it does so by grabbing one thing, and looking for another thing within it:
(@class, ‘jobWrap’)
is saying that the div class should contain ‘jobWrap’ (bonus points: the @ sign indicates an attribute; class is an attribute of the div; ‘jobWrap’ is the value of the attribute)
]
…finishes off that test.
Even if you don’t understand the code itself, you can adapt it to your own purposes as long as you can find the right div class tag and replace ‘jobWrap’ with whatever the value is in your case.
It doesn’t even have to be a div class – you could replace //div with other tags such as //p for each paragraph fitting a particular criteria.
You can also replace @class with another attribute, such as @id or @title. It depends on the HTML of the page you’re trying to grab information from.
Where’s the structure come from?
Why has this data been put into 3 columns? The answer is in the HTML again. You’ll see that the job title is between h4 tags. The location and package is within ul tags and the description is within p tags, before each div is closed with the tag /div
But if you keep reading that HTML you’ll also see that after that /div there is some more information within a different div tag: div class=”adBody”. This contains the name of the recruiter and a link to a page where you can apply. There’s also a third div with a link to an image of the recruiter.
You could adapt your importXML formula to grab these instead – or add a new formula in D2 to add this extra information alongside the others (watch out for mismatches where one div may be missing for some reason).
Finding and cleaning links
You’ll notice that the formula above grabs text, but not the links within each job ad. To do that we need to adapt the formula as follows. Try typing this in cell D2:
This is identical to the previous formula, with one addition at the end:
//@href
What this does is grab the value of any link in the HTML. In other words, the bit after a href=”
You’ll notice that the results are partial URLs, such as /job/3807/senior-account-executive-account-manager/
These are known as relative URLs, because they are relative to the site they are on, but will not work when placed on another site.
This is easily cleaned up. In cell E2 type the following:
=CONCATENATE(“http://www.gorkanajobs.co.uk”,D2)
This creates a new URL beginning with http://www.gorkanajobs.co.uk and ending with the contents of cell D2 – the relative URL. Copy the formula down the column so it works for all cells in column D.
Not always so tidy
Not all websites will be so structured. The more structured the webpage – or the data within it – the better. But you may have to dig into the HTML and/or tweak your formula to find that structure. Or you may have to settle for some rough and ready data that you clean later.
The key advantage of =importXML, however, is how it is able to pull information from HTML into a table that you can then interrogate, with different columns for different parts of that data.
Finally, this can be useful because Google Docs allows you to receive notifications whenever any changes are made, and to publish your spreadsheet as an RSS feed. This is explained in this blog post, which is also the source of the movie above.
Asking questions of a webpage – or find out when the answer changes
Despite its name, the =importXML formula can be used to grab information from HTML pages as well. This post on SEO Gadget, for example, gives a series of examples ranging from grabbing information on Twitter users to price information and web analytics (it also has some further guidance on using these techniques, and is well worth a read for that).
Asking questions of webpages typically requires more advanced use of XPath than I outlined previously – and more trial and error.
This is because, while XML is a language designed to provide structure around data, HTML – used as it is for a much wider range of purposes – isn’t quite so tidy.
Finding the structure
To illustrate how you can use =importXML to grab data from a webpage, I’m going to grab data from Gorkana, a job ads site.
Via the Guardian Datablog, I see that the Cabinet Office has just opened up a couple of consultations around open data:
– Consultation on Data Policy for a Public Data Corporation [homepage] [Consultation]
Here are the consultation questions (also available via SurveyMonkey: PDC consultation):
Chapter 4 – Charging for PDC information
How do you think Government should best balance its objectives around increasing access to data and providing more freely available data for re-use year on year within the constraints of affordability? Please provide evidence to support your answer where possible.
Are there particular datasets or information that you believe would create particular economic or social benefits if they were available free for use and re-use? Who would these benefit and how? Please provide evidence to support your answer where possible.
What do you think the impacts of the three options would be for you and/or other groups outlined above? Please provide evidence to support your answer where possible.
A further variation of any of the options could be to encourage PDC and its constituent parts to make better use of the flexibility to develop commercial data products and services outside of their public task. What do you think the impacts of this might be?
Are there any alternative options that might balance Government’s objectives which are not covered here? Please provide details and evidence to support your response where possible.
Chapter 5 – Licensing
To what extent do you agree that there should be greater consistency, clarity and simplicity in the licensing regime adopted by a PDC?
To what extent do you think each of the options set out would address those issues (or any others)? Please provide evidence to support your comments where possible.
What do you think the advantages and disadvantages of each of the options would be? Please provide evidence to support your comments
Will the benefits of changing the models from those in use across Government outweigh the impacts of taking out new or replacement licences?
Chapter 6 – Regulatory oversight
To what extent is the current regulatory environment appropriate to deliver the vision for a PDC?
Are there any additional oversight activities needed to deliver the vision for a PDC and if so what are they?
What would be an appropriate timescale for reviewing a PDC or its constituent parts public task(s)?
An enhanced right to data: how do we establish stronger rights for individuals, businesses and other actors to obtain, use and re-use data from public service providers? [link]
Setting transparency standards: what would standards that enforce this right to data among public authorities look like? [link]
Corporate and personal responsibility: how would public service providers be held to account for delivering open data through a clear governance and leadership framework at political, organisational and individual level? [link]
Meaningful Open Data: how should we ensure collection and publication of the most useful data, through an approach enabling public service providers to understand the value of the data they hold and helps the public at large know what data is collected? [link]
Government sets the example: in what ways could we make the internal workings of government and the public sector as open as possible? [link]
Innovation with Open Data: to what extent is there a role for government to stimulate enterprise and market making in the use of open data? [link]
I haven’t had chance to read through the consultation docs yet, but I’ll try and comment somewhere, as well as responding…
The way the consultations are presented
As to the way the consultations are presented themselves, two approaches have been taken:
– the PDC consultation embeds documenents at chapter level hosted on Scribd in a preview widget, with questions made available via a Word document or via SurveyMonkey. There doesn’t appear to be an opportunity to comment on the BIS site that is hosting the PDC consultation, even though it’s a WordPress platform running the Commentariat2 theme. To my mind, the way this consultation has be published, it’s not really of the web, and, to use a technical term, feels a little bit horrible to me… Maybe they don’t want flame wars on the bis.gov.uk domain about “Charging for PDC information”?!;-)
– the Making it Real consultation is hosted on the data.gov.uk site, with HTML text split at “chapter” (section) level, and commenting at that level via a single bottom of the page comment box. Where documents take close reading, I think this makes commenting difficult: if you want to refer to specific, detailed points in the consultation document, I’d say it makes sense to be able to see comment at the point of reference. That is, the comment box needs to be where you can see the actual bit of text you are commenting on (which is one reason why we often annotate documents with marginalia, rather than on a separate piece of paper). Where the comment box is fixed at the bottom of the page, you need two windows open to have side by side commenting and viewing of the actual text you are commenting on.
If we hadn’t decided that things had moved on enough in the way consultations were being handled to close WriteToReply (WriteToReply is closing. Come get your data if you want it), I think there’s a good chance we would have hosted both these consultations… Maybe our thinking that WriteToReply had nudged things far enough was a bit hasty? (The digress.it theme is out there, but as yet hasn’t been trialled on a departmental basis, I don’t think, even though we did try to respond to the commissioned accessibility audit. (Are Scribd docs accessible?) Digress.it is running on the JISCPress site though.
(I’m suddenly fired up again by the thought that consultation docs could be so much more “of the web” as well as easier to engage with… Hmmm, when’s the closing date for these consultations? Maybe there is time for one last WriteToReply outing…?)
While it’s one thing to understand interactive storytelling, community management, or the history of online journalism, the changes that are affecting journalism are wider than the industry itself. So although I’ve written previously on essential books about online journalism, I wanted to also compile a list of books which I think are essential for those wanting to gain an understanding of wider dynamics affecting the media industries and, by extension, journalism.
These are books that provide historical context to the hysteria surrounding technologies; that give an insight into the cultural movements changing society; that explore key philosophical issues such as privacy; or that explore the commercial dynamics driving change.
But they’re just my choices – please add your own.
Another way for the database challenged (such as myself!) for merging two datasets that share at least one common column…
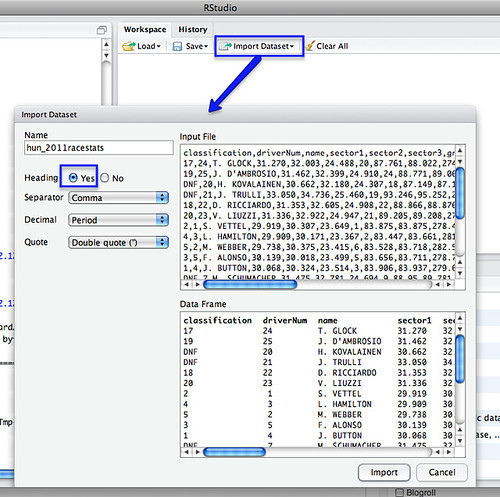
This recipe using the cross-platform stats analysis package, R. I use R via the R-Studio client, which provides an IDE wrapper around the R environment.
So for example, here’s how to merge a couple of files sharing elements in a common column…
First, load in your two data files – for example, I’m going to load in separate files that contain qualifying and race stats from the last Grand Prix:
We can merge the datasets using a command of the form:
The by parameter identifies which column we want to merge the tables around. (If the two datasets have different column names, you need to set by.x= and by.y= to specify the column from each dataset that is the focus for merging).
So for example, in the simple case where we are merging around two columns of the same name in different tables:
Merging datasets in R
After the merge, column names for columns from the first table have the .x suffix added, and from the second, .y.
We can then export the combined dataset as a CSV file:
write.csv(m, file = "demoMerge.csv")
[If you want to extract a subset of the columns, specify the required columns in an R command of the form: m2=m[c(“driverNum”,”name.x”,”ultimate.x”,”ultimate.y”)] See also: R: subset]
Simples;-)
PS in the above example, the merge table only contains merged rows. If there are elements in the common column of one table, but not the other, that partial data will not be included in the merged table. To include all rows, set all=TRUE. To include all rows from the first table, but not unmatched rows from the second, set all.x=TRUE; (the cells from columns in the unmatched row of the second table will be set to NA). (all.y=TRUE is also legitimate). From the R merge documentation:
In SQL database terminology, the default value of all = FALSE [the default] gives a natural join, a special case of an inner join. Specifying all.x = TRUE gives a left (outer) join, all.y = TRUE a right (outer) join, and both (all=TRUE a (full) outer join. DBMSes do not match NULL records, equivalent to incomparables = NA in R.
When Laura Kuenssberg announced she was leaving the BBC for ITV, muchwasmade of what might happen to her Twitter account. Was @BBCLauraK owned by her employer? (After all, it was branded as such, promoted on TV, and tweets were ‘processed’ by BBC producers). Or should Laura be able to take it with her? (After all, it was Laura that people were following, rather than a generic BBC political news feed).
The implications for the ‘journalist as brand‘ meme were wellexploredtoo, while newly empowered journalists may have been concerned to read that companies are inserting social media clauses into contracts:
“To keep hold of the good will created by a brand personality. Recruiters, for example, are often required to hand over their LinkedIn accounts upon leaving, so their contacts remain with the employer.”
“When she had earlier tweeted the details of a new separate ITV account to her then 59,000 followers, only around 1,000 of them started following the new account.”
This sounds compelling until you remember that tweets are only seen for a relatively brief period of time by those followers who happen to be watching at that moment, and that a significant proportion of followers of celebrity/high profile accounts are likely to be idle or spam.
Still, it also highlights the fundamental weakness in all the debates about who ‘owns’ a Twitter account. One very important party is not being represented: the users.
Much of the commentary on Laura Kuenssberg’s move treated her 60,000 followers as an “audience”. But of course, they are not: they are users.
Some will be personal acquaintances; some will be fans of the BBC’s political coverage; and yes, some will be spam accounts or accounts set up by curious BBC viewers who forgot their password the next day. Some will follow her to ITV, some will follow her replacement at the BBC, and some never worked out how to click ‘unfollow’. (Kuenssberg’s successor – @BBCNormanS – had 5,824 followers after she tweeted a link, according to Paul Gregory, which means that only around 10% of her followers read either of those tweets and acted on them.)
Whether an employer claims ownership of a social media account or not, they cannot ‘own’ the relationship between users and that account. And there will be as many relationships as users. Some passive; some collaborative; some neglected; some exploitative.
It is those relationships that we should be concerned with developing, not the small print of an employee’s contract.