
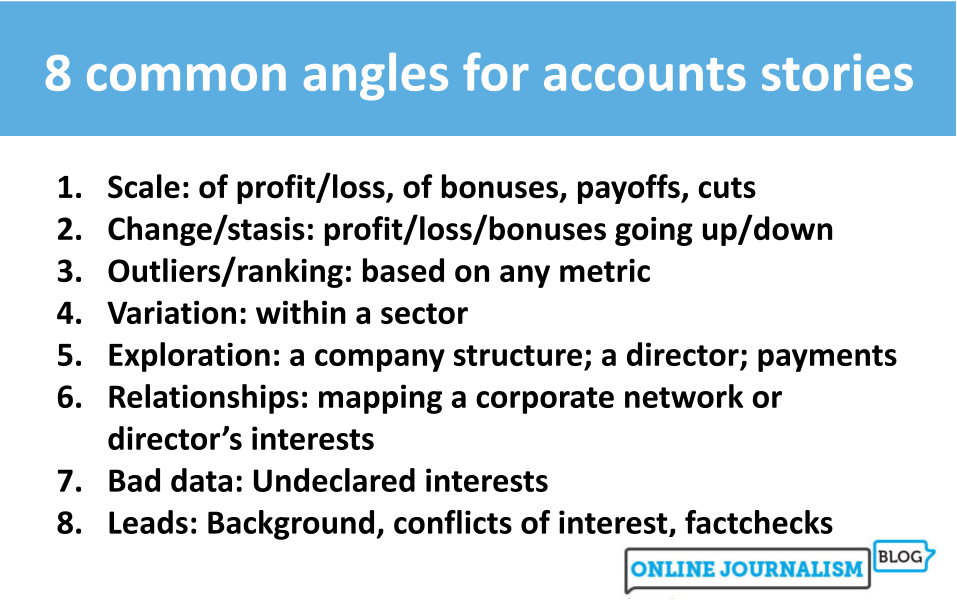
A couple of years ago I mapped out eight common angles for identifying stories in data. It turns out that the same framework is useful for finding stories in company accounts, too — but not only that: the angles also map neatly onto three broad techniques.
In this post I’ll go through each of the three techniques — looking at cash flow statements; compiling data from multiple accounts; and tracing people and connections — and explain how they can be used to get stories, with examples of articles that have used those techniques successfully.
We start, naturally, with the money…
Technique 1: counting the money (scale or change stories)
Not all stories from company accounts involve money — they can be about relationships, or what’s written — but money is at the core of a company’s annual accounts, and probably the most reliable source of a story: if you know how to read them you can guarantee a story about change or scale from pretty much any company’s accounts.
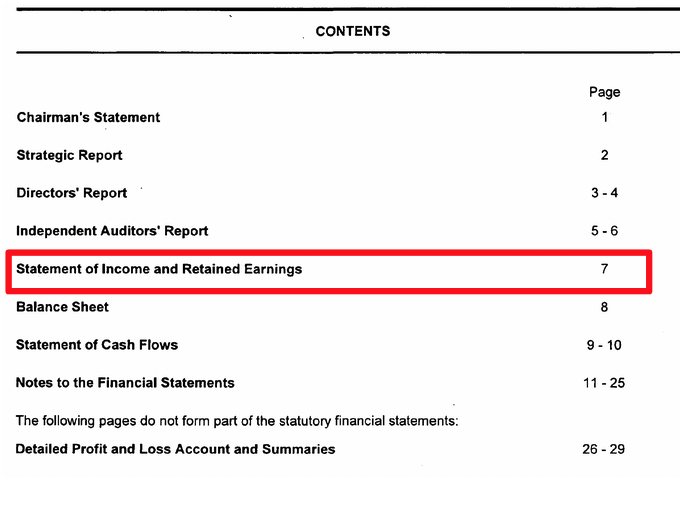
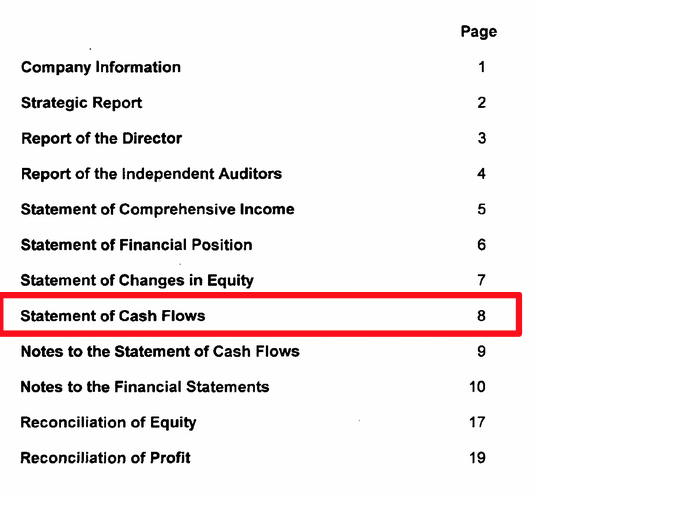
The key technique on this front is understanding the cash flow statement. This is the first table of figures in most company accounts, and shows how cash flows into the company (in the form of turnover or revenue), and out again (in the form of costs and tax).
Sometimes it’s called a statement of income (or consolidated statement of income) but generally the thing to look for is a table showing words like ‘income’, ‘profit’, and ‘tax’.
Not all companies will have a cash flow statement in their accounts: smaller companies don’t have to include this (they only have to include details on assets and debts) so you won’t be able to do this with them.


The key thing with the cash flow statement is that it’s a table – and it should show not only the latest year’s figures, but also the figures for the year before.
That means you can pick any row in that statement, and tell a story about how it has changed.
For example:
- You could say that the company is doing twice as much business as the previous year — or it’s doing 20% less. This is the first line in the statement: turnover (sometimes it’s called revenue)
- Note that this is different to how much profit the business is making — that’s something else you can tell a story about. You’ll notice that the statement actually has more than one row showing profit — but you can tell a story about any of those.
- You can tell a story about whether costs have gone up or down. This is best looked at relative to turnover: if a company is doing more business you’d expect it to also have higher costs, but if costs have increased proportionally more than turnover then that’s potentially newsworthy — especially in the context of inflation
- You could say that the company paid less tax this year — or actually got a tax rebate, or didn’t pay a lot considering the amount of business it was doing.
Each of these changes is relatively easy to calculate:
- Subtract the previous year’s figure from this year’s figure to get the change in terms of money (e.g. a change from £2m to £2.5m is calculated as 2.5 minus 2, which equals 0.5). If the numbers have gone down you should get a negative figure.
- Then divide the change by the previous year’s figure to get that change as a percentage (e.g. we would divide the change of 0.5 by the older figure of 2, which equals 0.25). Again, if the numbers have gone down you should get a negative result.
- That result will often be a decimal, where 0.5 means 50%, 0.1 means 10% and so on (1 means 100%). In a spreadsheet you can click the ‘percent’ button to format this as a percentage: 0.25 will format as 25%, for example. Or you can simply multiply it by 100 to see what that decimal is in percentage terms.
The resulting story might only be 100 words or so — but look out for sections in the accounts that might provide quotes you can draw from, and of course contact the organisation to see if you can get a quote directly. That quote might end up being the main focus of your story and the numbers become the background to that.
Note that the phrase “latest year” is key — you’ll be looking at figures not for the current year, but the latest year that is being reported. So for example some accounts published in December 2022 may be about a financial year that ended in September 2021.
Technique 2: Compiling data to find a story about ranking or variation — or to write an exploratory feature
Once you’ve got to grips with a cash flow statement, you can use a second technique to get a different type of story: one about how different companies in a sector (or which are connected in some other way) rank, or vary.
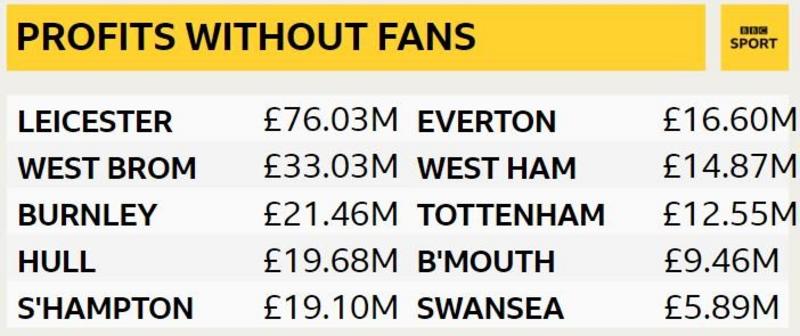
This is the technique that the BBC Data Unit used to tell a story about football club finances: we created a spreadsheet and entered specific data points from the company accounts of each football club, such as how much revenue they had, how much gross profit, and — where a breakdown was given — how much of their revenue came from fans attending games (ticket sales).
When compiling the data you should:
- Be specific about which data points (e.g. executive pay) you want to tell a story about — and create a column for each of those. Don’t enter unnecessary data.
- Make sure there’s a column for the name the company is known by and another one for the official name of the company — this is often not the same thing. For example, Deliveroo’s official name is Roofoods Ltd.
- Make sure there’s a column for the ‘year ending’
- Make sure you enter each year’s data in a different row (for the latest accounts, for example, a company should have one row for the latest year’s figures, and a second row for the previous year’s figures)
I’ve written more advice on data entry projects here.

Compiling this data means you can create a pivot table that shows — for all companies in your sample — an overview of a particular aspect of their finances.
Specifically, in the pivot table you can put the company name in ‘Rows’, the year covered in ‘Columns’ and a numerical column (such as turnover) in ‘Values’.
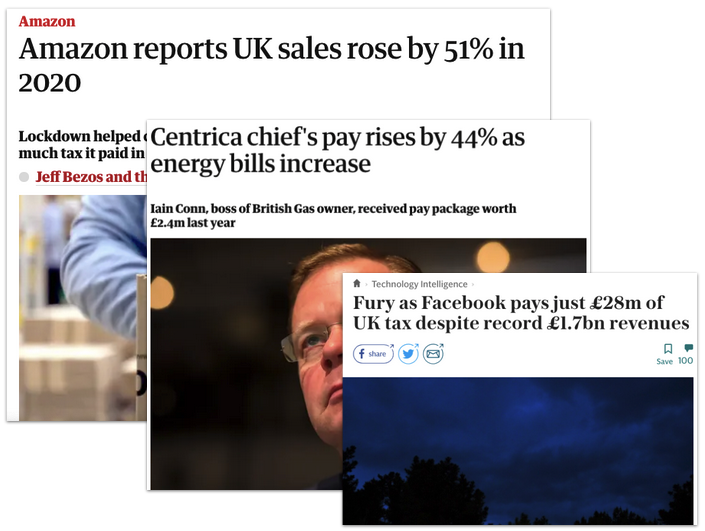
You can use this technique to report stories revealing which companies in a particular field are expanding the most, or who ranks bottom for tax payments when compared to operating profit. You can report whether the field as a whole is making “excessive profits”; or if there is “significant variation” in financial health.
Exploratory features can use this technique, too, allowing you to take the reader on a tour of the ‘winners and losers’ in a particular field, or identify to what degree particular industry issues and trends are affecting different key players. This might involve moving from scale, to change, ranking and variation all within the same article.

Technique 3: Telling stories about relationships, bad data — or identifying interesting leads
The final technique for getting a story out of company accounts is to focus on relationships.
You can find relationship data in both the accounts themselves and on company registers where those are published, such as Companies House and OpenCorporates. It includes:
- Who is, and was, a director or secretary in a company (in the UK this is found in the ‘Persons’ tab in Companies House)
- What other companies they are/were a director or secretary in (search for their name on Companies House or OpenCorporates)
- ‘Persons with significant control‘ who, for example, own significant shares and/or voting rights (in the ‘Persons’ tab in Companies House, under the Persons with Significant Control sub-tab)
- ‘Related party transactions‘, such as loans or sales of items to directors, payments to relatives, or to other companies in the group, etc. are at the end of a company’s accounts. This area is also where you will find…
- Which companies own which other companies (parents and subsidiaries) and
- Who is the ‘ultimate beneficial owner‘ of a company (not just the immediate parent, but the last owner in the ownership trail)
- The location where a company is registered (on the company’s main page in Companies House)
- Other companies registered at that location (search by location on OpenCorporates or Companies House)
- The location where a director was registered (found under their name in the ‘Persons’ tab in Companies House)
- The dates when a company was registered, or changed details (on the company’s main page in Companies House)
One journalistic application of this information is to simply use it to map the ‘complex network’ of a company or person, as in Radiohead’s corporate empire: inside the band’s dollars and cents.
Or it can be used to explain the timeline of events leading up to a business’s collapse (or success), as in Michael Aylwin’s “inside story” of the collapse of rugby club Worcester Warriors.
When a company is the focus of a current news story, relationships can add important context and challenge spin. In one story about Covid contracts the FT’s Anna Gross uses relationship data to report that one company’s directors “previously worked in shoe sales and property, and do not have a background in health” while a Guardian story by Sandra Laville uses it to reveal that:
“West Cumbria Mining positioned itself as a local company … during its campaign for permission to extract 2.8m tonnes of coking coal a year from the site. But the owners of the company are based thousands of miles away. West Cumbria Mining itself is based in Sussex, according to Companies House, and ultimately owned by a private equity investment firm, EMR Capital, with a base in the tax haven of the Cayman Islands.”
Story leads can be found at the end of company accounts, where related payments are detailed. Potential conflicts of interests are the most obvious leads here — and concerns or questions that might be raised (or answered), as in this story about a charity that employed the wife of the UK prime minister which “paid more than £150,000 in ‘interior design services’ to [the] chairman’s wife”.
Relationships between addresses can be used to connect businesses, people and property. They have also been used to establish the scale and location of ‘burner companies’ — a form of ‘bad data‘ story.
Another form of bad data story can be found when relationships are declared in one place but not another: many people in positions of power have to declare any directorships on a register of interests. A failure to do so can be a story in itself.
Where next?
Understanding which of those three techniques — mapping relationships; looking at the money of one company; and compiling data from multiple companies — you need to adopt in a story helps to clarify the next steps, including the potential challenges. You’ll find more examples of those techniques in action in the following posts:
- VIDEO PLAYLIST: Finding stories in company accounts
- This is a masterclass in writing a story about company directors’ pay — so I reverse-engineered it
- Here’s a story about a celebrity fashion charity which provides some useful tips and tricks for journalists using company accounts
- Here’s how one journalist used all sorts of company account techniques to tell a story about a social media platform for sex workers
- Here are 9 ways to find stories in company accounts (and only three of them involve numbers)

Pingback: Menos gente quiere informarse: cómo hacer para que permanezcan - Medianalisis