
Documents and other collections of text can be goldmines for data journalism — if you know how to approach them as data. Here are some techniques and inspiration for your next data project.
From stories about political speech and song lyrics, to street names and social media chatter, data journalists now have a wide range of examples of text-as-data to draw inspiration and guidance from, while tools such as Pinpoint and NotebookLM are making text analysis easier than ever.
I compiled a list of over 200 pieces of data journalism where text or documents were used as sources. Quantification techniques ranged from counting the frequency of a single word and using Google’s ngram viewer, to machine learning and topic modelling.
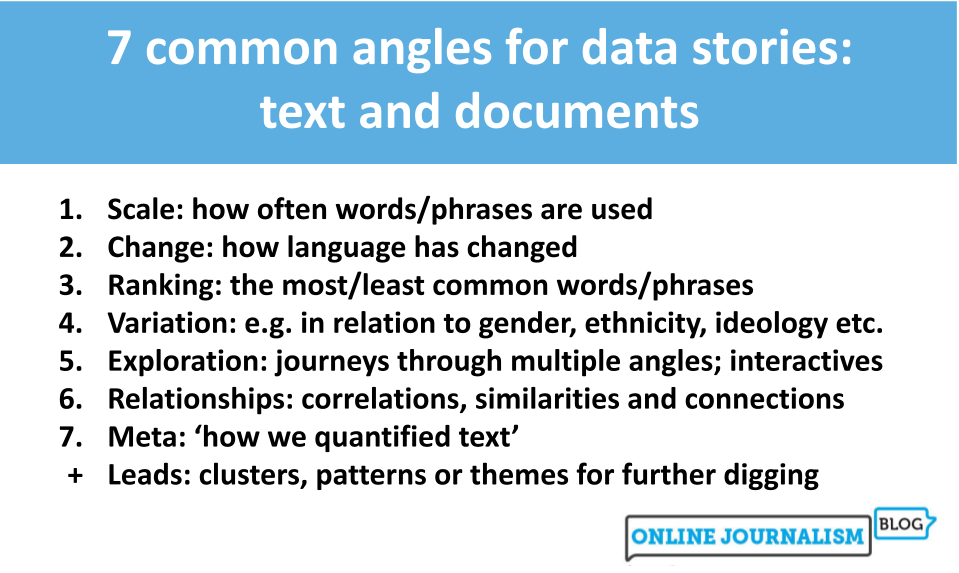
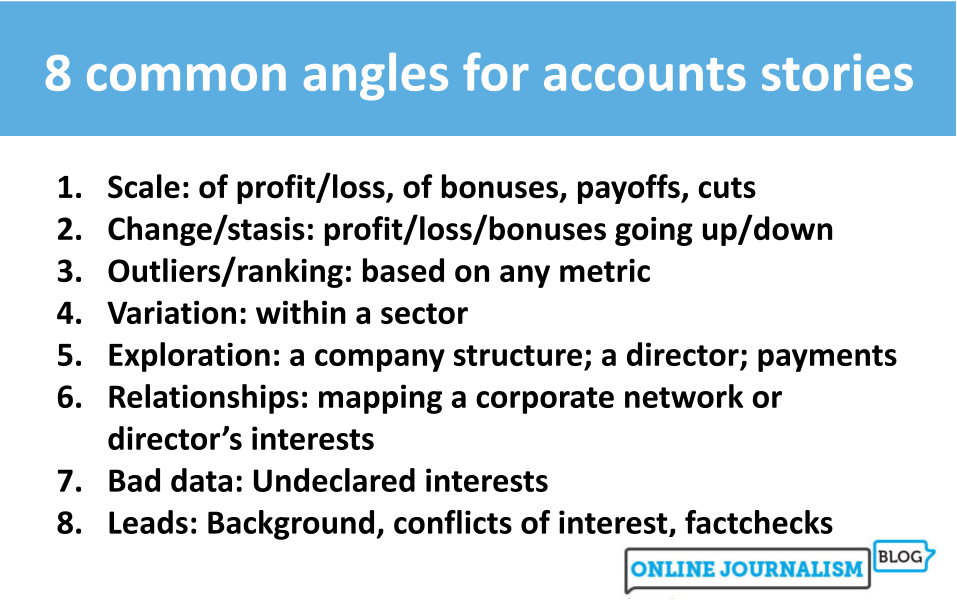
Looking at those articles it’s clear that, once quantified, journalists tell the same stories about text as any other piece of data: using the seven most common angles.
But how those angles are used — and how often — is where it gets interesting…
