Author Archives: Paul Bradshaw

A case study in online journalism part 2: verification, SEO and collaboration (investigating the Olympic torch relay)

corporate Olympic torchbearers image

Having outlined some of the data journalism processes involved in the Olympic torch relay investigation, in part 2 I want to touch on how verification and ‘passive aggressive newsgathering’ played a role.

Verification: who’s who

Data in this story not only provided leads which needed verifying, but also helped verify leads from outside the data.

In one example, an anonymous tip-off suggested that both children of one particular executive were carrying the Olympic torch on different legs of the relay. A quick check against his name in the data suggested this was so: two girls with the same unusual surname were indeed carrying the torch. Neither mentioned the company or their father. But how could we confirm it?

The answer involved checking planning applications, Google Streetview, and a number of other sources, including newsletters from the private school that they both attended which identified the father.

In another example, I noticed that one torchbearer had mentioned running alongside two employees of Aggreko, who were paying for their torches. I searched for other employees, and found a cake shop which had created a celebratory cake for three of them. Having seen how some corporate sponsors used their places, I went on a hunch and looked up the board of directors, searching in the data first for the CEO Rupert Soames. His name turned up – with no nomination story. A search for other directors found that more than half the executive board were carrying torches – which turned out to be our story. The final step: a call to the company to get a reaction and confirmation.

The more that we knew about how torch relay places had been used, the easier it was to verify other torchbearers. As a pattern emerged of many coming from the telecomms industry, that helped focus the search – but we had to be aware that having suspicions ‘confirmed’ didn’t mean that the name itself was confirmed – it was simply that you were more likely to hit a match that you could verify.

Scepticism was important: at various times names seemed to match with individuals but you had to ask ‘Would that person not use his title? Why would he be nominated? Would he be that age now?’

Images helped – sometimes people used the same image that had been used elsewhere (you could match this with Google Images ‘match image’ feature, then refine the search). At other times you could match with public photos of the person as they carried the torch.

This post on identifying mystery torchbearers gives more detail.

Passive aggressive newsgathering

Alerts proved key to the investigation. Early on I signed up for daily alerts on any mention of the Olympic torch. 95% of stories were formulaic ‘local town/school/hero excited about torch’ reports, but occasionally key details would emerge in other pieces – particularly those from news organisations overseas.

Google Alerts for Olympic torch

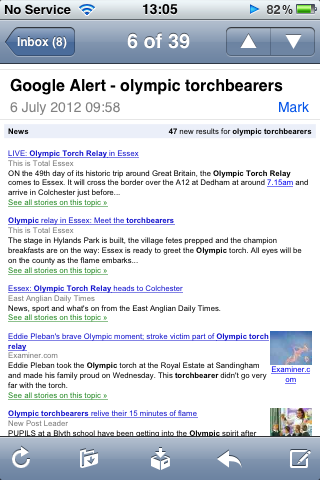
It was from these that I learned how many places exactly Dow, Omega, Visa and others had, and how many were nominated. It was how I learned about torchbearers who were not even listed on the official site, about the ‘criteria’ that were supposed to be adhered to by some organisations, about public announcements of places which suggested a change from previous numbers, and more besides.

As I came across anything that looked interesting, I bookmarked and tagged it. Some would come in useful immediately, but most would only come in useful later when I came to write up the full story. Essentially, they were pieces of a jigsaw I was yet to put together.  (For example, this report mentioned that 2,500 employees were nominated within Dow for just 10 places. How must those employees feel when they find the company’s VP of Olympic operations took up one of the few places? Likewise, he fit a broader pattern of sponsorship managers carrying the torch)

I also subscribed to any mention of the torch relay in Parliament, and any mention in FOI requests.

SEO – making yourself findable

One of the things I always emphasise to my students is the importance of publishing early and often on a subject to maximise the opportunities for others in the field to find out – and get in touch. This story was no exception to this. From the earliest stages through to the last week of the relay, users stumbled across the site as they looked for information on the relay – and passed on their concerns and leads.

It was particularly important with a big public event like the Olympic torch relay, which generated a lot of interest among local people. In the first week of the investigation one photographer stumbled across the site because he was searching for the name of one of the torchbearers we had identified as coming from adidas. He passed on his photographs – but more importantly, made me aware that there may be photographs of other executives who had already carried the torch.

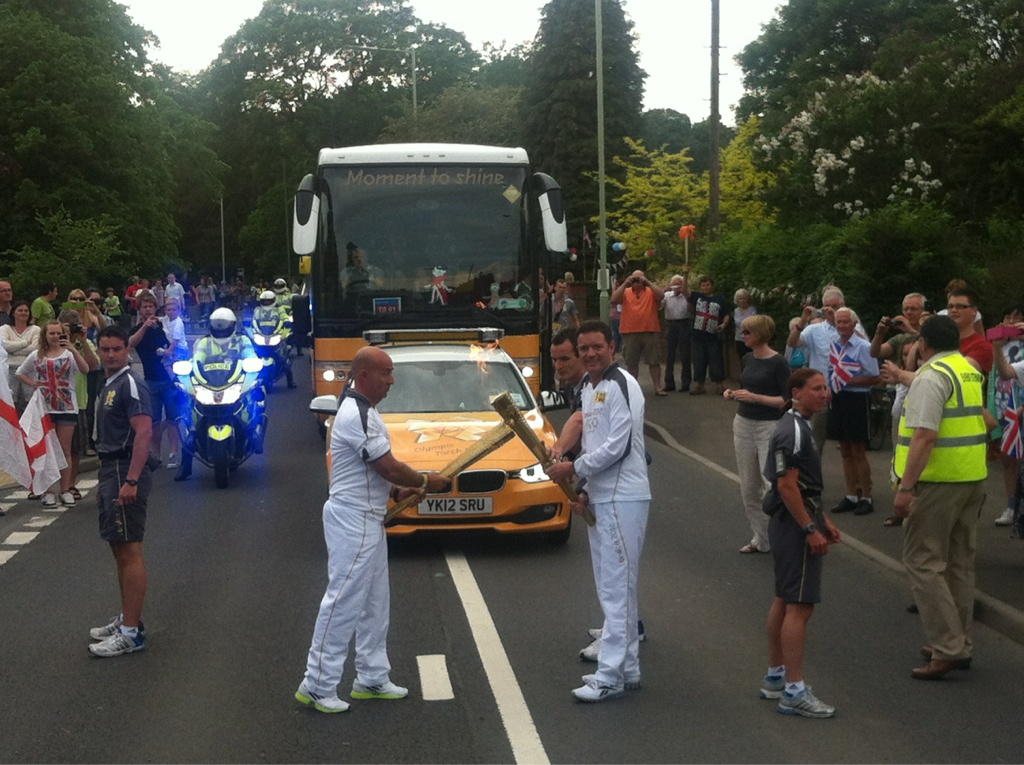
That led to the strongest image of the investigation – two executives exchanging a ‘torch kiss’ (shown at the top of this post) – which was in turn picked up by The Daily Mail.

Other leads kept coming. The tip-off about the executive’s daughters mentioned above; someone mentioning two more Aggreko directors – one of which had never been published on the official site, and the other had been listed and then removed. Questions about a Polish torchbearer who was not listed on the official site or, indeed, anywhere on the web other than the BBC’s torch relay liveblog. Challenges to one story we linkblogged, which led to further background that helped flesh out the processes behind the nominations given to universities.

When we published the ‘mystery torchbearers’ with The Guardian some got in touch to tell us who they were. In one case, that contact led to an interview which closed the book: Geoff Holt, the first quadriplegic to sail single-handed across the Atlantic Ocean.

Collaboration

I could have done this story the old-fashioned way: kept it to myself, done all the digging alone, and published one big story at the end.

It wouldn’t have been half as good. It wouldn’t have had the impact, it wouldn’t have had the range, and it would have missed key ingredients.

Collaboration was at the heart of this process. As soon as I started to unearth the adidas torchbearers I got in touch with The Guardian’s James Ball. His report the week after added reactions from some of the companies involved, and other torchbearers we’d simultaneously spotted. But James also noticed that one of Coca Cola’s torchbearers was a woman “who among other roles sits on a committee of the US’s Food and Drug Administration”.

It was collaborating with contacts in Staffordshire which helped point me to the ‘torch kiss’ image. They in turn followed up the story behind it (a credit for Help Me Investigate was taken out of the piece – it seems old habits die hard), and The Daily Mail followed up on that to get some further reaction and response (and no, they didn’t credit the Stoke Sentinel either). In Bournemouth and Sussex local journalists took up the baton (sorry), and the Times Higher did their angle.

We passed on leads to Ventnor Blog, whose users helped dig into a curious torchbearer running through the area. And we published a list of torchbearers missing stories in The Guardian, where users helped identify them.

Collaborating with an international mailing list for investigative journalists, I generated datasets of local torchbearers in Hungary, Italy, India, the Middle East, Germany, and Romania. German daily newspaper Der Tagesspiegel got in touch and helped trace some of the Germans.

And of course, within the Help Me Investigate network people were identifying mystery torchbearers, getting responses from sponsors, visualising data, and chasing interviews. One contributor in particular – Carol Miers – came on board halfway through and contributed some of the key elements of the final longform report – in particular the interview that opens the book, which I talk about in the final part of this series.

A case study in online journalism part 2: verification, SEO and collaboration (investigating the Olympic torch relay)

corporate Olympic torchbearers image

Having outlined some of the data journalism processes involved in the Olympic torch relay investigation, in part 2 I want to touch on how verification and ‘passive aggressive newsgathering’ played a role.

Verification: who’s who

Data in this story not only provided leads which needed verifying, but also helped verify leads from outside the data. Continue reading

A case study in online journalism: investigating the Olympic torch relay

Infographic: Where did the Olympic torch relay places go? What we know so far

image by @CarolineBeavon

For the last two months I’ve been involved in an investigation which has used almost every technique in the online journalism toolbox. From its beginnings in data journalism, through collaboration, community management and SEO to ‘passive-aggressive’ newsgathering,  verification and ebook publishing, it’s been a fascinating case study in such a range of ways I’m going to struggle to get them all down.

But I’m going to try.

Data journalism: scraping the Olympic torch relay

The investigation began with the scraping of the official torchbearer website. It’s important to emphasise that this piece of data journalism didn’t take place in isolation – in fact, it was while working with Help Me Investigate the Olympics‘s Jennifer Jones (coordinator for#media2012, the first citizen media network for the Olympic Games) and others that I stumbled across the torchbearer data. So networks and community are important here (more later).

Indeed, it turned out that the site couldn’t be scraped through a ‘normal’ scraper, and it was the community of the Scraperwiki site – specifically Zarino Zappia – who helped solve the problem and get a scraper working. Without both of those sets of relationships – with the citizen media network and with the developer community on Scraperwiki – this might never have got off the ground.

But it was also important to see the potential newsworthiness in that particular part of the site. Human stories were at the heart of the torch relay – not numbers. Local pride and curiosity was here – a key ingredient of any local newspaper. There were the promises made by its organisers – had they been kept?

The hunch proved correct – this dataset would just keep on giving stories.

The scraper grabbed details on around 6,000 torchbearers. I was curious why more weren’t listed – yes, there were supposed to be around 800 invitations to high profile torchbearers including celebrities, who might reasonably be expected to be omitted at least until they carried the torch – but that still left over 1,000.

I’ve written a bit more about the scraping and data analysis process for The Guardian and the Telegraph data blog. In a nutshell, here are some of the processes used:

  • Overview (pivot table): where do most come from? What’s the age distribution?
  • Focus on details in the overview: what’s the most surprising hometown in the top 5 or 10? Who’s oldest and youngest? What about the biggest source outside the UK?
  • Start asking questions of the data based on what we know it should look like – and hunches
  • Don’t get distracted – pick a focus and build around it.

This last point is notable. As I looked for mentions of Olympic sponsors in nomination stories, I started to build up subsets of the data: a dozen people who mentioned BP, two who mentioned ArcelorMittal (the CEO and his son), and so on. Each was interesting in its own way – but where should you invest your efforts?

One story had already caught my eye: it was written in the first person and talked about having been “engaged in the business of sport”. It was hardly inspirational. As it mentioned adidas, I focused on the adidas subset, and found that the same story was used by a further six people – a third of all of those who mentioned the company.

Clearly, all seven people hadn’t written the same story individually, so something was odd here. And that made this more than a ‘rotten apple’ story, but something potentially systemic.

Signals

While the data was interesting in itself, it was important to treat it as a set of signals to potentially more interesting exploration. Seven torchbearers having the same story was one of those signals. Mentions of corporate sponsors was another.

But there were many others too.

That initial scouring of the data had identified a number of people carrying the torch who held executive positions at sponsors and their commercial partners. The GuardianThe Independent and The Daily Mail were among the first to report on the story.

I wondered if the details of any of those corporate torchbearers might have been taken off off the site afterwards. And indeed they had: seven disappeared entirely (many still had a profile if you typed in the URL directly – but could not be found through search or browsing), and a further two had had their stories removed.

Now, every time I scraped details from the site I looked for those who had disappeared since the last scrape, and those that had been added late.

One, for example – who shared a name with a very senior figure at one of the sponsors – appeared just once before disappearing four days later. I wouldn’t have spotted them if they – or someone else – hadn’t been so keen on removing their name.

Another time, I noticed that a new torchbearer had been added to the list with the same story as the 7 adidas torchbearers. He turned out to be the Group Chief Executive of the country’s largest catalogue retailer, providing “continuing evidence that adidas ignored LOCOG guidance not to nominate executives.”

Meanwhile, the number of torchbearers running without any nomination story went from just 2.7% in the first scrape of 6,056 torchbearers, to 7.2% of 6,891 torchbearers in the last week, and 8.1% of all torchbearers – including those who had appeared and then disappeared – who had appeared between the two dates.

Many were celebrities or sportspeople where perhaps someone had taken the decision that they ‘needed no introduction’. But many also turned out to be corporate torchbearers.

By early July the numbers of these ‘mystery torchbearers’ had reached 500 and, having only identified a fifth, we published them through The Guardian datablog.

There were other signals, too, where knowing the way the torch relay operated helped.

For example, logistics meant that overseas torchbearers often carried the torch in the same location. This led to a cluster of Chinese torchbearers in StanstedHungarians in Dorset,Germans in BrightonAmericans in Oxford and Russians in North Wales.

As many corporate torchbearers were also based overseas, this helped narrow the search, with Germany’s corporate torchbearers in particular leading to an article in Der Tagesspiegel.

I also had the idea to total up how many torchbearers appeared each day, to identify days when details on unusually high numbers of torchbearers were missing – thanks to Adrian Short – but it became apparent that variation due to other factors such as weekends and the Jubilee made this worthless.

However, the percentage per day missing stories did help (visualised below by Caroline Beavon), as this also helped identify days when large numbers of overseas torchbearers were carrying the torch. I cross-referenced this with the ‘mystery torchbearer’ spreadsheet to see how many had already been checked, and which days still needed attention.

But the data was just the beginning. In the second part of this case study, I talk about the verification process, SEO and collaboration.

A case study in online journalism: investigating the Olympic torch relay

Infographic: Where did the Olympic torch relay places go? What we know so far

For the last two months I’ve been involved in an investigation which has used almost every technique in the online journalism toolbox. From its beginnings in data journalism, through collaboration, community management and SEO to ‘passive-aggressive’ newsgathering,  verification and ebook publishing, it’s been a fascinating case study in such a range of ways I’m going to struggle to get them all down.

But I’m going to try. Continue reading

Data Shaping in Google Refine – Generating New Rows from Multiple Values in a Single Column

One of the things I’ve kept stumbling over in Google Refine is how to use it to reshape a data set, so I had a little play last week and worked out a couple of new (to me) recipes.

The first relates to reshaping data by creating new rows based on columns. For example, suppose we have a data set that has rows relating to Olympics events, and columns relating to Medals, with cell entries detailing the country that won each medal type:

However, suppose that you need to get the data into a different shape – maybe one line per country with an additional column specifying the medal type. Something like this, for example:

How can we generate that sort of view from the original data set? Here’s one way, that works when the columns you want to split into row values are contiguous (that is, next to each other). From the first column in the set of columns you want to be transformed, select Transpose > Transpose cells across columns into rows:

We now set the original selected column headers to be the cell value within a new column – MedalType – and the original cell values the value within a Country column:

(Note that we could also just transform the data into a single column. For example, suppose we had columns relating to courses currently taken by a particular student (Course 1, Course 2, Course 3), with a course code as cell value and one, two or three columns populated per student. If we wanted one row per student per course, we could just map the three columns onto a single column – CourseCode – and assign multiple rows to each student, then filtering out rows with a blank value in the CourseCOde column as required.)

Ticking the Fill down in other columns checkbox ensures that the appropriate Sport and Event values are copied in to the newly created rows:

Having worked out how to do that oft-required bit of data reshaping, I thought I could probably have another go at something that has been troubling me for ages – how to generate multiple rows from a single row where one of the columns contains JSON data (maybe pulled from a web service/API) that contains multiple items. This is a “mate in three” sort of problem, so here’s how I started to try to work it back. Given that I now know how to map columns onto rows, can I work out how to map different results in a JSON response onto different columns?

For example, here’s a result from the Facebook API for a search on a particular OU course code and the word open in a Facebook group name:

{“data”:[{“version”:1,”name”:”U101 (Open University) start date February 2012″,”id”:”325165900838311″},{“version”:1,”name”:”Open university, u101- design thinking, October 2011″,”id”:”250227311674865″},{“version”:1,”name”:”Feb 2011 Starters U101 Design Thinking – Open University”,”id”:”121552081246861″},{“version”:1,”name”:”Open University – U101 Design Thinking, Feburary 2011″,”id”:”167769429928476″}],”paging”:{“next”:…etc…}}

It returns a couple of results in the data element, in particular group name and group ID. Here’s one way I found of creating one row per group… Start off by creating a new column based on the JSON data column that parses the results in the data element into a list:

We can then iterate over the list items in this new column using the forEach grel command. The join command then joins the elements within each list item, specifically the group ID and name values in each result:

forEach(value.parseJson(),v,[v.id,v.name].join('||'))

You’ll notice that for multiple results, this produces a list of joined items, which we can also join together by extending the GREL expression:

forEach(value.parseJson(),v,[v.id,v.name].join('||')).join('::')

We now have a column that contains ‘||’ and ‘::’ separated items – :: separates individual group results from each other, || separates the id and name for each particular group.

Given we know how to create rows from multiple columns, we could try to split this column into separate columns using Edit column > Split into separate columns. This would create one column per result, which we could then transform into rows, as we did above. Whilst I don’t recommend this route in this particular case, here’s how we could go about doing it…

A far better approach is to use the Edit cells > split multi-valued cells option to automatically create new rows based on splitting the elements in a single column:

Note, however that this creates blanks in the other columns, so we need to Edit cells > Fill down to fill in the blanks in any other columns we want to refer to. After doing that, we end up with something like this:

We could now split the groupPairs column using the || separator to create two columns – Group ID and group name – giving us one row per group, and separate columns identifying the course, group name and group ID.

If the above route seems a little complicated, fear not…Once you apply it, it starts to make sense!

Interview: the team behind the Transcribe audio transcription app

After test-driving the audio transcription app Transcribe, Antoinette Siu interviewed Jason and Kishore of Wreally Studios, the team behind Transcribe.

What do you hope to do with this project?

We want to make journalists’ lives easier through software. From what we’ve heard, transcription is one of their pain points and while Transcribe can’t do the transcription automatically for them (at least, not yet) we could make the transcription process a little easier for them through our tool. Continue reading

Review: Transcribe – a free browser-based app to make audio transcription easier

Antoinette Siu takes a look at a new free app which promises to make transcribing audio easier.

Transcribing audio is one of the most time-consuming tasks in a journalist’s job. Switching between the audio player and the text editor, rewinding every 20 seconds in, typing frantically to catch every syllable—repeating these steps back and forth, and back and forth… in an age of so much automation, something isn’t quite right.

A new Chrome app tool called Transcribe lets you do all that in one screen. With keyboard shortcuts and an audio file uploader, you can easily go back and forth between your sound and text. Continue reading

Hyperlocal Voices: Richard Gurner, Caerphilly Observer

For the fourth in our new series of Hyperlocal Voices we head back to Wales. Launched by Richard Gurner in July 2009, the Caerphilly Observer acts as a local news and information website for Caerphilly County Borough.

The site is one of a small, but growing, number of financially viable hyperlocal websites. Richard, who remains the Editor of the site, told Damian Radcliffe a little bit about his journey over the last three years. Continue reading

Searching for a Map of Designated Public Places…

A discussion, earlier, about whether it was now illegal to drink in public…

…I thought not, think not, at least, not generally… My understanding was, that local authorities can set up controlled, alcohol free zones and create some sort of civil offence for being caught drinking alcohol there. (As it is, councils can set up regions where public consumption of alcohol may be prohibited and this prohibition may be enforced by the police.) So surely there must be an #opendata powered ‘no drinking here’ map around somewhere? The sort of thing that might result from a newspaper hack day, something that could provide a handy layer on a pub map? I couldn’t find one, though…

I did a websearch, turned up The Local Authorities (Alcohol Consumption in Designated Public Places) Regulations 2007, which does indeed appear to be the bit of legislation that regulates drinking alcohol in public, along with a link to a corresponding guidance note: Home Office circular 013 / 2007:

16. The provisions of the CJPA [Criminal Justice and Police Act 2001, Chapter 2 Provisions for combatting alcohol-related disorder] should not lead to a comprehensive ban on drinking in the open air.

17. It is the case that where there have been no problems of nuisance or annoyance to the public or disorder having been associated with drinking in that place, then a designation order … would not be appropriate. However, experience to date on introducing DPPOs has found that introducing an Order can lead to nuisance or annoyance to the public or disorder associated with public drinking being displaced into immediately adjacent areas that have not been designated for this purpose. … It might therefore be appropriate for a local authority to designate a public area beyond that which is experiencing the immediate problems caused by anti-social drinking if police evidence suggests that the existing problem is likely to be displaced once the DPPO was in place. In which case the designated area could include the area to which the existing problems might be displaced.

Creepy, creep, creep…

This, I thought, was interesting too, in the guidance note:

37. To ensure that the public have full access to information about designation orders made under section 13 of the Act and for monitoring arrangements, Regulation 9 requires all local authorities to send a copy of any designation order to the Secretary of State as soon as reasonably practicable after it has been made.

38. The Home Office will continue to maintain a list of all areas designated under the 2001 Act on the Home Office website: www.crimereduction.gov.uk/alcoholorders01.htm [I’m not convinced that URL works any more…?]

39. In addition, local authorities may wish to consider publicising designation orders made on their own websites, in addition to the publicity requirements of the accompanying Regulations, to help to ensure full public accessibility to this information.

So I’m thinking: this sort of thing could be a great candidate for a guidance note from the Home Office to local councils recommending ways of releasing information about the extent of designation orders as open geodata. (Related? Update from ONS on data interoperability (“Overcoming the incompatibility of statistical and geographic information systems”).)

I couldn’t immediately find a search on data.gov.uk that would turn up related datasets (though presumably the Home Office is aggregating this data, even if it’s just in a filing cabinet or mail folder somewhere*), but a quick websearch for Designated Public Places site:gov.uk intitle:council turned up a wide selection of local council websites along with their myriad ways of interpreting how to release the data. I’m not sure if any of them release the data as geodata, though? Maybe this would be an appropriate test of the scope of the Protection of Freedoms Act Part 6 regulations on the right to request data as data (I need to check them again…)?

* The Home Office did release a table of designated public places in response to an FOI request about designated public place orders, although not as data… But it got me wondering: if I scheduled a monthly FOI request to the Home Office requesting the data on a monthly basis, would they soon stop fulfilling the requests as timewasting? How about if we got a rota going?! Is there any notion of a longitudinal/persistent FOI request, that just keeps on giving (could I request the list of designated public places the Home Office has been informed about over the last year, along with a monthly update of requests in the previous month (or previous month but one, or whatever is reasonable…) over the next 18 months, or two years, or for the life of the regulation, or until such a time as the data is published as open data on a regular basis?

As for the report to government that a local authority must make on passing a designation order – 9. A copy of any order shall be sent to the Secretary of State as soon as reasonably practicable after it has been made. – it seems that how the area denoted as a public space is described is moot: “5. Before making an order, a local authority shall cause to be published in a newspaper circulating in its area a notice— (a)identifying specifically or by description the place proposed to be identified;“. Hmmm, two things jump out there…

Firstly, a local authority shall cause to be published in a newspaper circulating in its area [my emphasis; how is a newspaper circulating in its area defined? Do all areas of England have a non-national newspaper circulating in that area? Does this implicitly denote some “official channel” responsibility on local newspapers for the communication of local government notices?]. Hmmm…..

Secondly, the area identified specifically or by description. On commencement, the order must also be made public by “identifying the place which has been identified in the order”, again “in a newspaper circulating in its area”. But I wonder – is there an opportunity there to require something along the lines of and published using an appropriate open data standard in a open public data repository, and maybe further require that this open public data copy is the one that is used as part of the submission informing the Home Office about the regulation? And if we go overboard, how about we further require that each enacted and proposed order is published as such along with a machine readable geodata description and that a single aggregate files containing all that Local Authority’s currently and planned Designated Public Spaces are also published (so one URL for all current spaces, one for all planned ones). Just by the by, does anyone know of any local councils publishing boundary date/shapefiles that mark out their Designated Public Spaces? Please let me know via the comments, if so…

A couple of other, very loosely (alcohol) related, things I found along the way:

  • Local Alcohol Profiles for England: the aim appears to have been the collation of, and a way of exploring, a “national alcohol dataset”, that maps alcohol related health indicators on a PCT (Primary Care Trust) and LA (local authority) basis. What this immediately got me wondering was: did they produce any tooling, recipes or infrastructure that would it make a few clicks easy to pull together a national tobacco dataset and associated website, for example? And then I found the Local Tobacco Control Profiles for England toolkit on the London Health Observatory website, along with a load of other public health observatories and it made me remember – again – just how many data sensemaking websites there already are out there…
  • UK Alcohol Strategy – maybe some leads into other datasets/data stories?

PS I wonder if any of the London Boroughs or councils hosting regional events have recently declared any new Designated Public Spaces #becauseOfTheOlympics.

Scraping for Journalists – ebook out now

My ebook Scraping for Journalists: How to grab data from hundreds of sources, put it in a form you can interrogate – and still hit deadlines is now live.

You can buy it from Leanpub here. Leanpub allows you to publish in installments, so you get an alert every time new content is added and update your version. This means I can adapt and improve the book based on feedback from the people who use it. In other words, it’s agile publishing, which makes for a better book. (Also, I can publish at a Codecademy-like weekly pace which suits learning particularly well.)

There’s a Facebook page and a support blog for the book for commenting too.

Meanwhile, here’s a presentation I did at News:Rewired last week which covers some of the ground from the book: