
Over on the Help Me Investigate blog I’ve published a guide to extracting data from council budget reports. Very timely, you see. Let me know what you do with it.

Over on the Help Me Investigate blog I’ve published a guide to extracting data from council budget reports. Very timely, you see. Let me know what you do with it.
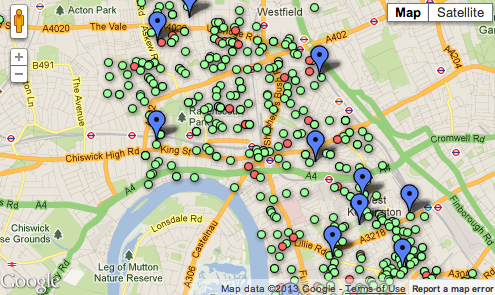
Sid Ryan’s planning applications map
Sid Ryan wanted to see if planning applications near planning committee members were more or less likely to be accepted. In two guest posts on Help Me Investigate he shows how to research people online (in this case the councillors), and how to map planning applications to identify potential relationships.
The posts take in a range of techniques including:
If you find it useful, please let me know – and if you can add anything… please do.
Motion graphics has become an increasingly popular way to present data in a compelling visual form. In a series of videos guest contributor Sihlangu Tshuma outlines his workflow process for managing a motion graphics video project, the results of which are shown at the end. All 13 videos are also available in this playlist.

I’ve been working recently with the Birmingham Mail to launch Behind The Numbers, a new datablog project with Birmingham City University supported by Help Me Investigate. I’m told that it is probably the UK’s first regional newspaper datablog, although whether that’s a meaningful claim is debatable*.
The first story generated by the project – what is the worst time to be seen at A&E – was published in the newspaper a week ago. But it’s what happens next that’s going to be interesting. Continue reading

Sometimes the most impressive tools solve a problem you never knew you had. In the case of QueryTree, a new data analysis tool, that problem is something most people never question: spreadsheets.
For all the shiny-shiny copy-and-paste-click-and-drag-ness in new journalism tools, most data digging comes back to at least some simple spreadsheet work, and that represents a significant hurdle for many journalists used to working with simpler tools.
While interface design has undergone generations of improvement on the web, spreadsheet software interfaces have remained largely unchanged for decades.
So why did no one think to do this before?

As a result of two contributors landing jobs, both Help Me Investigate Education and Help Me Investigate Welfare are looking for new editors.
You don’t need anything more than curiosity and persistence – I’ll try to help with everything else.
If you’re interested, email paul@helpmeinvestigate.com.
As part of my ongoing FAQ series, here are some answers in English to an interview by Balkan magazine Medicentar_Online: Continue reading
The Data Driven Journalism website asked me a few questions as part of their end-of-2012 roundup. You can find the article there, but for the sake of archiving, my responses are copied below (without the helpful pictures they added):
I’m a data journalism trainer and Iecturer. I run the MA in Online Journalism at Birmingham City University and am a visiting professor in online journalism at City University London. I’m also the author of Scraping for Journalists.
An investigation into the allocation of Olympic torchbearer places. The investigation came about as a result of scraping details on torchbearers from the official website. But it was also a great example of collaboration between non-journalists and journalists, as well as a number of techniques outside of core data journalism.
The investigation led to questions in Parliament and international media coverage. In the final week of the Olympic torch relay we published a short ebook about the affair, with all proceeds going to the Brittle Bone Society.
I really liked Landportal.info, which is attempting to map land ownership – it’s highlighting a global trend of companies buying up land in Africa which would be easy to overlook by journalists. The New York Times’s multimedia treatment of performance data in three Olympic events across over a century was really well done. And I’m always looking at how data journalism can be used in softer news, where Anna Powell-Smith’s What Size Am I? is a great example of fashion/consumer data journalism.
For sheer significance I can’t avoid mentioning Nate Silver’s work on the US election – that was a watershed for data journalism and an embarrassment for many political pundits.
There’s a lot of consolidation at the moment, so less of the spectacular developments – but I am excited at how data journalism is being taken on by a wider range of companies. This year I’ve spent a lot more time training staff at consumer magazine publishers, for example.
I’m also excited about some of the new journalism startups based on public data like Rafat Ali’s Skift. In terms of tools, it’s great to see network analysis added to Fusion Tables, and the Knight Digital Media Center’s freeDive makes it very easy indeed to create a public database from a Google Doc.
I am constantly disappointed by publishers who say they don’t have the resources to do data journalism. That shows a real lack of imagination and understanding of what data journalism really is. It doesn’t have to be a spectacular interactive data visualisation – it can simply be about getting to better stories more quickly, accurately and more deeply through a few basic techniques.
I’ve just been training someone from Chile so I’m hoping to see more data journalism there!
Happy Christmas!
French data journalist Nicolas Kayser-Bril (and former OJB contributor) gave the keynote speech at news:rewired. He used to work for OWNI, but since 2011 has been the CEO of Journalism++, a start-up that ‘accompanies newsrooms in their transitions towards the web of data’.
During his presentation he tried to explain the first steps that anyone interested in this area should follow to start producing stories, like building a datastore.
After the speech we had a quick chat with him about the importance of introducing data in newsrooms, the situation in France (where he feels data journalism is very dynamic – “a lot of people are doing stuff, like in Liberátion or Le Monde”) and the skills that a journalist should have to get started. “There are some stories nowadays that require the use of data intensely,” he says. “Especially when it comes into public policies.”
“As a data journalist you need curiosity and the ability to teach yourself: the basic skills of any journalist.”
