In the second part of this extract from a book chapter in the new Routledge Companion to Visual Journalism, I look at the editorial processes involved in data visualisation, along with the ethical considerations and challenges encountered along the way.
Decisions around what data to visualise and how to visualise it involve a range of ethical considerations and challenges, and it is important to emphasise that data visualisation is an editorial process just as much as any other form of factual storytelling.
Journalists and designers employ a range of rhetorical devices to engage an audience and communicate their story, from the choice of the chart and its default views or comparisons, to the use of colour, text and font, and animations and search suggestions (Segel and Heer 2011; Hullman & Diakopoulos 2011).
Chart types are story genres
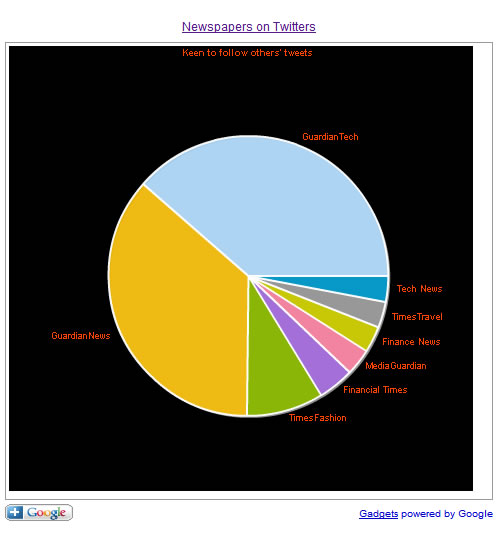
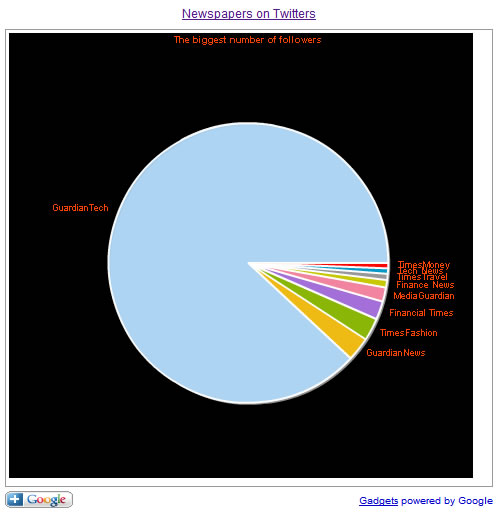
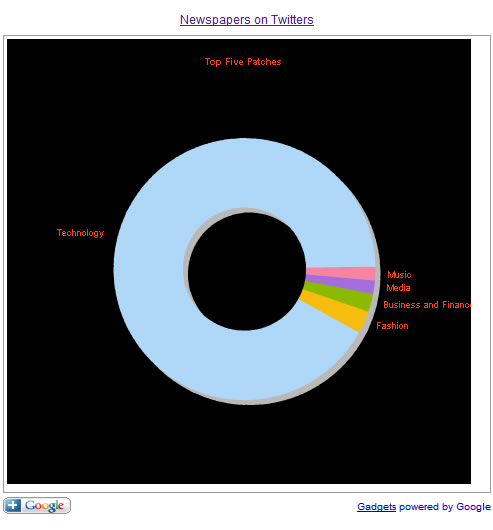
The chart that a journalist chooses to visualise data plays a key role in suggesting the type of story that is being told, and what the user might do with the data being displayed.
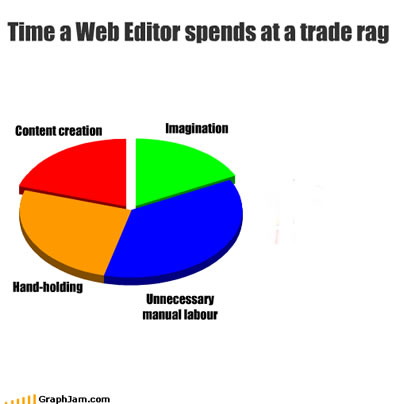
If a pie chart is chosen then this implies that the story is about composition (parts of a whole). In contrast, if a bar chart is used then the story is likely to be about comparison.
Line charts imply that the reader is being invited to see something changing over time, while histograms (where bars are plotted along a continuum, rather than ranked in order of size) invite us to see how something is distributed across a given scale.
Scatterplots — which plot points against two values (such as the cancer rate in each city against the same city’s air pollution) — invite us to see relationships.
Continue reading