In 2016 Tumblr got angry

In 2016 Tumblr got angry
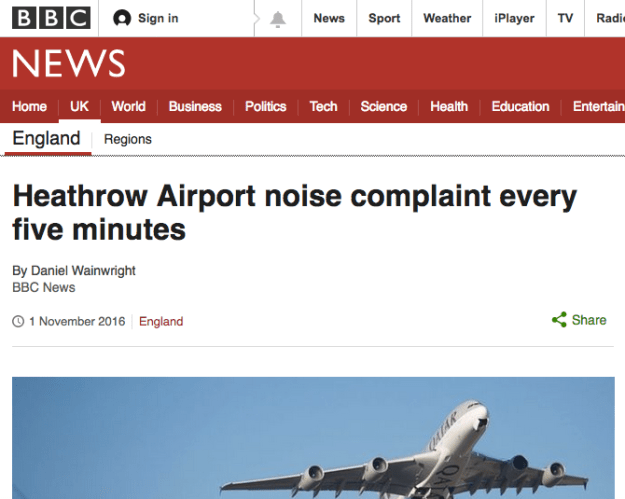
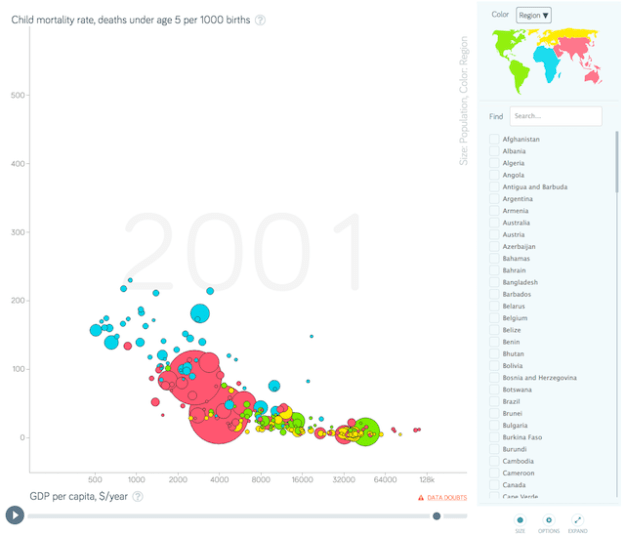
This news story used scraping to gather data on noise complaints
I’d wondered for a while why no-one who had talked about scraping at conferences had actually demonstrated the procedure. It seemed to me to be one of the most sought-after skills for any investigative journalist.
Then I tried to do so myself in an impromptu session at the first Data Journalism Conference in Birmingham (#DJUK16) and found out why: it’s not as easy as it’s supposed to look.
To anyone new to data journalism, a scraper is as close to magic as you get with a spreadsheet and no wand. Continue reading
Chat app Telegram was ahead of the curve on bots – has it just kicked off another race to create chat-optimised publishing formats?
Instant View, launched overnight, is Telegram’s answer to Facebook’s Instant Articles (added to Messenger in July), Google’s AMP and Apple News: a way for publishers to make sure content loads quickly.
For now it’s only being used by publications using Medium, and TechCrunch, but the announcement promises:
“Eventually we want to provide Instant View pages for every story on the Web”
If you’ve watched the shifts in user behaviour from web to social, and then from social to chat, you can see what might be coming next: another battle to optimise for where the eyeballs are.
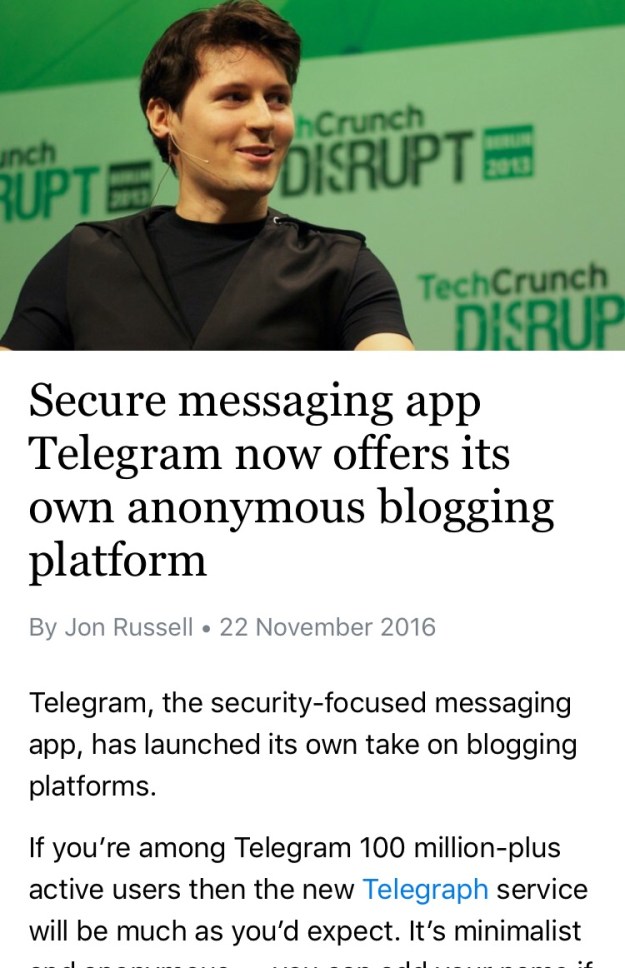
This is what an Instant View article looks like within the Telegram app
As well as announcing its new article format Telegram has launched an anonymous publishing CMS: Telegra.ph.
One of Telegram’s major selling points is its security and Telegra.ph is a perfect extension to that.
Tonight many journalists will have Tweetdeck or similar social media dashboards ‘tuned in’ to coverage of the US election, typically by creating columns to monitor activity on key hashtags like #Election2016. But on a big occasion like this, the volume of tweets becomes unmanageable. Here then are a few quick techniques to surface tweets that are likely to be most useful to reporters:
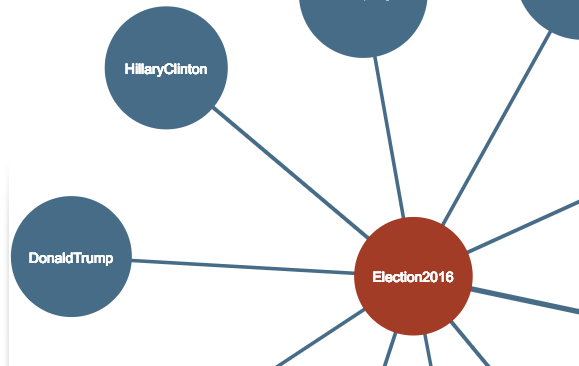
Hashtagify is a tool for finding out the popularity of certain hashtags. Type a tag into the search box and you’ll get a network diagram like the one shown above — but you can also switch to ‘Table mode’ to get a list of tags that you can sort by popularity, correlation, weekly or monthly trend. Continue reading
Data visualisation experts Andy Kirk and Cole Nussbaumer Knaflic – judges in this year’s Kantar Information is Beautiful Awards 2016 – have given OJB 5 tips to help those who want to sharpen up their own data science skills. Here they are:
Andy Kirk: Trust is hard to earn but easy to lose so ensuring your work is trustworthy is of paramount importance. Truthfulness and accuracy should be an obligation. Continue reading
 In just over 4 weeks I’ll be holding a day of workshops and industry panels for aspiring and working data journalists across the UK. Want to come?
Data Journalism UK 2016, in Birmingham on November 22, will be focusing on the latest wave of regional data journalism projects, from the data journalists at Trinity Mirror and BBC Scotland to startups like Northern Ireland’s The Detail and winners of Google Digital News Initiative funding Talk About Local’s News Engine and the Bureau of Investigative Journalism.
I’m particularly pleased to have one of the most experienced data journalists in the country, Claire Miller, speaking too.
Claire Miller, author of the book Getting Started with Data Journalism
The event will mix industry speakers and experts with practical sessions: there’ll be drop-in sessions on getting started with data journalism, an information security ‘surgery’, and some speakers have been asked to focus on practical skills too.
On top of all that, attendees will have the opportunity to nominate skills they want to learn – we’ll put on workshops for the most popular topics!
You can sign up for the event here, and tell me what sessions you want covered on Twitter @paulbradshaw
The event is being jointly sponsored by the University of Stirling and Birmingham City University.
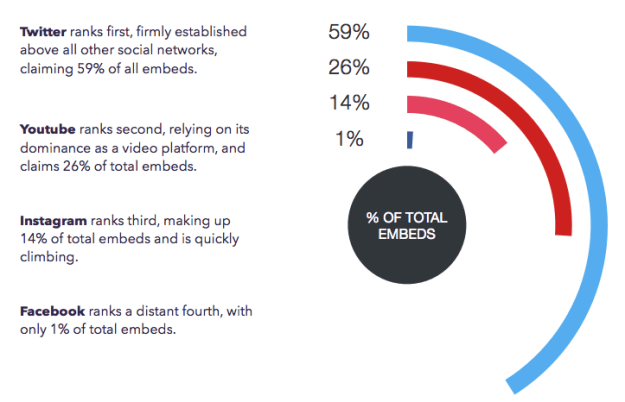
Image: The State of Social Embeds
Every web journalist knows that linking is one of the most fundamental qualities of online journalism: a web article without links is like TV without moving images.
But in the last couple of years something else has become equally important: I’m talking about the embed.
Two years ago I noted how publishers were finally getting to grips with linking – and how embedding was a major factor in that.
As material from social media has become increasingly central to news stories, content management systems have finally been adapted to allow journalists to embed the very elements they were talking about: that controversial tweet; the Facebook reaction; the damning Instagram snap; the viral YouTube video.
Now, one report has noted that almost a quarter of 1 million news articles in a study included embedded media. Continue reading
Alastair Good was a solo video journalist for The Telegraph for a decade before recently going freelance. As part of work on the forthcoming second edition of the Online Journalism Handbook, I interviewed Alastair about his experiences of filming video at the Calais migrant camp. I’m republishing it in full here.
The refugee/migrant camp in Calais had been growing steadily for some time. Estimates varied between five and ten thousand people who had travelled from the southern part of the globe to escape war, persecution and poverty. They were all hoping for just one thing: the chance to make a dangerous journey across the Channel to Britain.
One of my contacts in an aid agency working in the camp called me to say that bulldozers were due to move in to clear the camp the next day. I pitched the story to my editor and was on the Eurostar by the afternoon. Continue reading
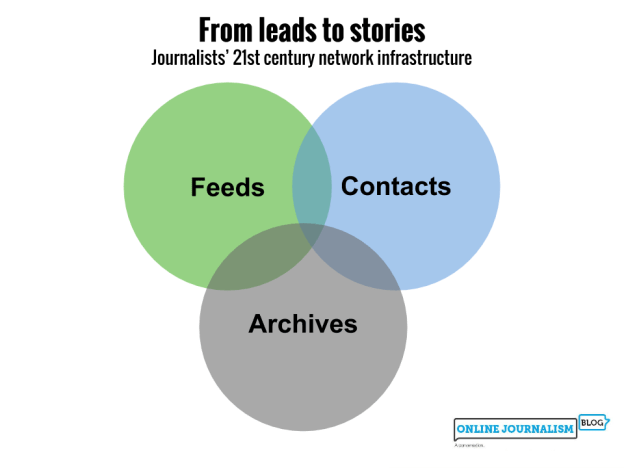
Tools for managing feeds, contacts and archives are merging
Well here’s an update: not only is that infrastructure now a reality, but it has become much more complex. And as these tools have become more widely adopted it has shifted the focus on information management from the institution to the individual journalist. Continue reading
Twitter’s analytics service is a useful tool for journalists to understand which tweets are having the biggest impact. The dashboard at analytics.twitter.com provides a general overview under tabs like ‘tweets’ and ‘audiences’, and you can download raw data for any period then sort it in a spreadsheet to see which tweets performed best against a range of metrics.
However, if you want to perform any deeper analysis, such as finding out which days are best for tweeting or which times perform best — you’ll need to get stuck in. Here’s how to do it. Continue reading