Category Archives: data journalism

All the news that’s fit to scrape

Channel 4/Scraperwiki collaboration

There have been quite a few scraping-related stories that I’ve been meaning to blog about – so many I’ve decided to write a round up instead. It demonstrates just the increasing role that scraping is playing in journalism – and the possibilities for those who don’t know them:

Scraping company information

Chris Taggart explains how he built a database of corporations which will be particularly useful to journalists and anyone looking at public spending:

“Let’s have a look at one we did earlier: the Isle of Man (there’s also one for Gibraltar, Ireland, and in the US, the District of Columbia) … In the space of a couple of hours not only have we liberated the data, but both the code and the data are there for anyone else to use too, as well as being imported in OpenCorporates.”

OpenCorporates are also offering a bounty for programmers who can scrape company information from other jurisdictions.

Scraperwiki on the front page of The Guardian…

The Scraperwiki blog gives the story behind a front page investigation by James Ball on lobbyist influence in the UK Parliament: Continue reading

Getting full addresses for data from an FOI response (using APIs)

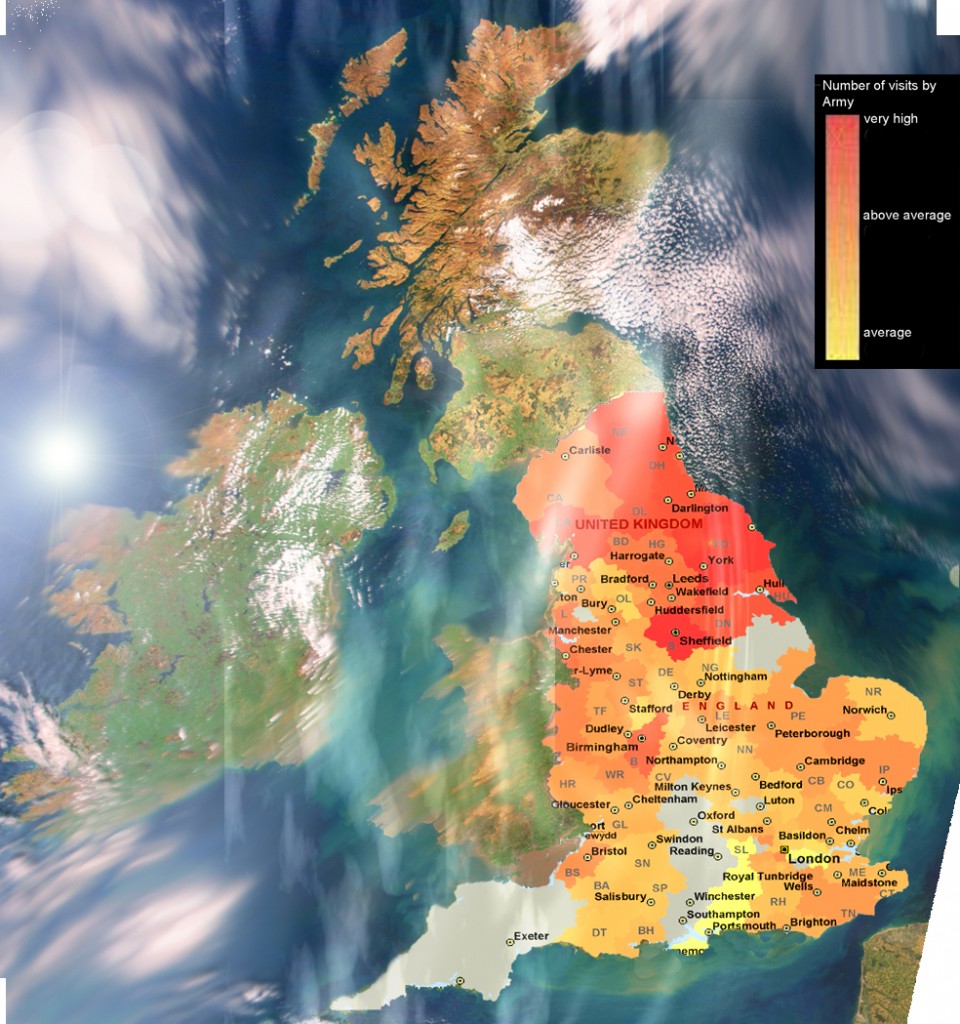
heatfullcolour11-960x1024

Here’s an example of how APIs can be useful to journalists when they need to combine two sets of data.

I recently spoke to Lincoln investigative journalism student Sean McGrath who had obtained some information via FOI that he needed to combine with other data to answer a question (sorry to be so cryptic).

He had spent 3 days cleaning up the data and manually adding postcodes to it. This seemed a good example where using an API might cut down your work considerably, and so in this post I explain how you make a start on the same problem in less than an hour using Excel, Google Refine and the Google Maps API.

Step 1: Get the data in the right format to work with an API

APIs can do all sorts of things, but one of the things they do which is particularly useful for journalists is answer questions. Continue reading

Leaks on demand – how the Wikileaks cables are being used

From a leak to a flood

Image by markhillary on Flickr

I’m probably not the only person to notice a curious development in how the Wikileaks material is being used in the press recently. From The Guardian and The Telegraph to The New York Times and The Washington Post, the news agenda is dictating the leaks, rather than the other way around.

It’s fascinating because we are used to seeing leaks as precious journalistic material that forms the basis of some of our best reporting. But the sheer volume of Wikileaks material – the vast majority of which still remains out of the public domain – has turned that on its head, with newsrooms asking: “Do the leaks say anything on Libya/Tunisia/Egypt?”

When they started dealing with Wikileaks data some newsrooms built customised databases to allow them to quickly find relevant documents. Recent events have proved that – not to mention the recruitment of staff who can quickly interrogate that data – to be very wise.

Matt Wells on The Guardian’s interactive protests Twitter map

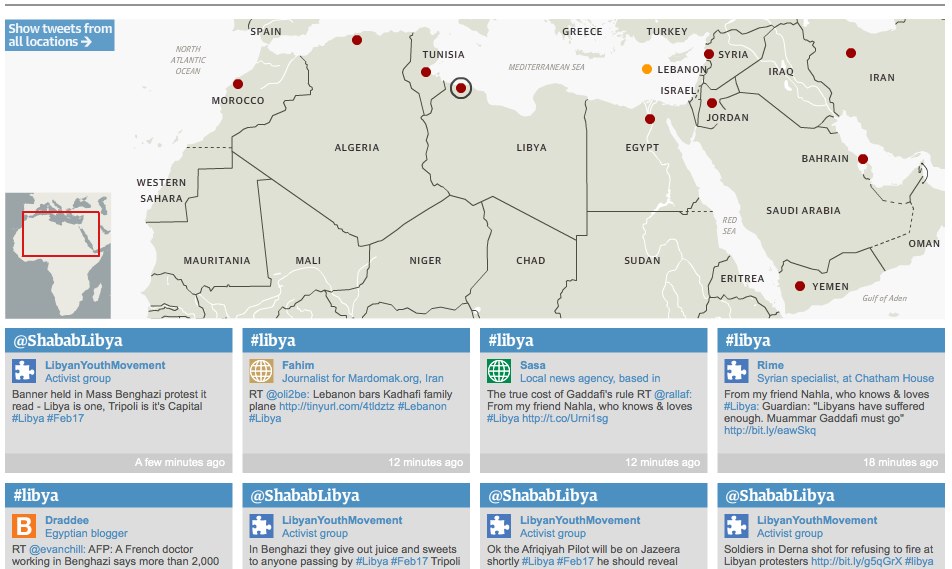
Twitter network of Arab protests - interactive map | guardian.co.uk

Twitter network of Arab protests – interactive map | guardian.co.uk

The Guardian have published an impressive map displaying Twitter coverage of protests around the Arab world and the Middle East. I asked Matt Wells, who oversaw the project, to explain how it came about.

The initial idea, which I should credit to deputy editor Ian Katz, was to build something that showcased the tweets of our correspondents, along a broader network of vetted tweeters in different countries. We wanted to connect all of these on a map, so you could click on a country and see relevant live-updating tweets.

I was asked to oversee it. The main thing was to check out the best English-language tweeters in each country – preferably people who appeared reliable, who were involved in first-hand reporting themselves, and who did a lot of retweeting of others.

I started by asking our correspondents who they followed, then broadened it out from there. We asked everyone if they minded being included – we had one refusal from a Tweeter in a particularly authoritartian country who was worried about the exposure. Everyone else thought it was a great idea.

Meanwhile one of our developers, Garry Blight, overseen by Alastair Dant, set about building it. As with anything of this kind, it took a bit longer than orginally anticipated, but we had it ready on the day that Mubarak fell. And brilliantly, it has worked for every country since then.

It’s powered by a Google spreadsheet – so it’s really easy to add new people and to attach them to particular countries or search terms.

And it should be very easily adaptable for other news events around the world.

Bella Hurrell on data journalism and the BBC News Specials Team

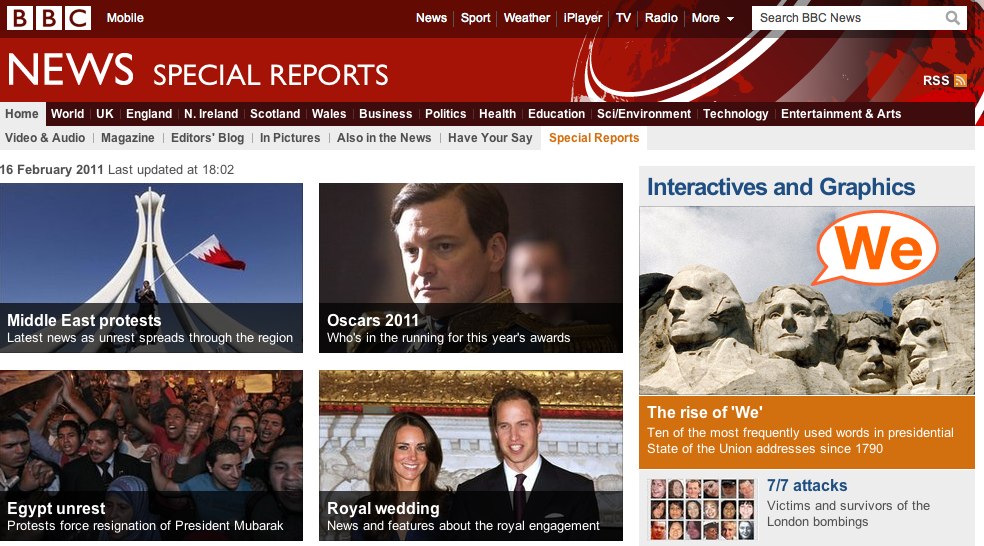
BBC_Special_ReportsBella Hurrell is the Specials Editor with BBC News Online. I asked her how data journalism was affecting their work for a forthcoming article. Here is her response in full:

The BBC news specials team produces multimedia interactives, daily graphics as well as more complex data visualisations. The team consists of journalists, designers and developers all working closely together, sitting alongside each other.

We have found that proximity really important to the success of projects. Although we have done this for a while, increasingly other organisations are reorganising along these lines after coming to realise the benefits of breaking down silos and co-locating people with different skillsets can produce more innovative solutions at a faster pace.

As data visualisation has come into the zeitgeist, and we have started using it more regularly in our story-telling, journalists and designers on the specials team have become much more proficient at using basic spreadsheet applications like Excel or Google Docs. We’ve boosted these and other skills through in house training or external summer schools and conferences.

Data as a service, data as a story

There are two interrelated elements to data journalism: firstly data as a service, often involving publicly available data.  The school league tables which the BBC news website has produced every year for over a decade are an example here. We know they are hugely popular and they provide a valuable public service for users. More recently the government has started to get better at putting data / information  online, so we have adjusted our coverage. Instead of replicating what is done by government sites (such as providing individual school pages) we try to provide value by doing something extra, such as mini charts and the ability to select and compare schools – as well as news stories and analysis.

The second element is data as a story. The simple fact that loads of data has been published is not really very interesting to most people. Data is only useful if it is personal – I want to find out about schools in my area, restaurants near me and so on – or when it reveals something remarkable. The duck pond debacle from MPs expenses data or the Iraq civilian death records kept by the US revealed by Wikileaks’ release of the Iraq war documents are both examples of individual stories from big tranches of data that really resonated.

Dealing with large numbers of documents

With data stories that involve thousands of documents we face two challenges. Firstly deciding whether we can provide a platform or tool for people to look at the documents or data. This can be valuable but might involve significant technical resources and may not be worth doing if others are already providing this service.

Secondly we need to find the stories and then report them but clearly that can be tricky when there are thousands of documents to examine. Crowdsourcing is an obvious approach but we need to use what the crowd tells us. When readers told us about potential stories they spotted in the MPs expenses data we pulled in our whole politics team off normal duties to sift users’ questions and put them directly to the relevant MPs. Then we published their answers on our site. This is a very resource heavy approach and not sustainable over a long time.

Another model for reporting stories that involve large sets of data was Panorama’s public sector pay story, where the website partnered with the investigative unit to tell the story online. The Panorama team spent months collecting data and we provided simple visualisations and  a way for users to examine the data.

Tell the government what you want from the Public Data Corporation

Public Data Corporation consultation

If who are excited about the prospect of open data, but frustrated by its execution (or just one of those people who complain that data doesn’t change anything), the government are inviting comments on what shape the Public Data Corporation should take.

It’s a refreshingly simple execution: a WordPress blog with each question as a separate blog post – presumably it cost a lot less than £300,000. But of course the questions are theirs, and they are:

1.      Which public sector datasets do you currently make use of?

2.      How easy is it to find out what datasets are held by public sector organisations?

3.      How do you, or would you, decide whether a dataset has value for you or for your organisation? What affects how valuable they are, for example timeliness, granularity, format?

4.      Which datasets are of most value to you or your organisation? Why?

5.      What methods of access to datasets would most benefit you or your organisation?

6.      What gets in the way of you or your organisation accessing datasets or data products?

7.      What are the most exciting applications of datasets or data products you are aware of – here or internationally? We are, again, particularly interested in the following areas: registration activities, environmental science, critical infrastructure and the built environment.

8.      Are there any datasets or products you’d like to see generated? How would you or your organisation use them, and what social or economic benefits do you think they would deliver?

9.      From your perspective, what would success look like for the Public Data Corporation?

10.  Have we got the name for this organisation right?  Do you have any suggestions on naming that might better convey our aims?

It’s a shame that there isn’t any space for more open discussion – and that so many of the questions resemble market research. But still, the more journalists who pile in – the more justifiably we can moan later. So go ahead.

Post your responses here.

3 things that BBC Online has given to online journalism

It’s now 3 weeks since the BBC announced 360 online staff were to lose their jobs as part of a 25% cut to the online budget. It’s a sad but unsurprising part of a number of cuts which John Naughton summarises as: “It’s not television”, a sign that “The past has won” in the internal battle between those who saw consumers as passive vessels for TV content, and those who credited them with some creativity.

Dee Harvey likewise poses the question: “In the same way that openness is written into the design of the Internet, could it be that closedness is written into the very concept of the BBC?”

If it is, I don’t think it can remain that way for ever. Those who have been part of the BBC’s work online will feel rightly proud of what has been achieved since the corporation went online in 1997. Here are just 3 ways that the corporation has helped to define online journalism as we know it – please add others that spring to mind:

1. Web writing style

The BBC’s way of writing for the web has always been a template for good web writing, not least because of the BBC’s experience with having to meet similar challenges with Ceefax – the two shared a content management system and journalists writing for the website would see the first few pars of their content cross-published on Ceefax too.

Even now it is difficult to find an online publisher who writes better for the web.

2. Editors blogs

Thanks to the likes of Robin Hamman, Martin Belam, Jem Stone and Tom Coates – to name just a few – when the BBC did begin to adopt blogs (it was not an early adopter) it did so with a spirit that other news organisations lacked.

In particular, the Editors’ Blogs demonstrated a desire for transparency that many other news organisations have yet to repeat, while the likes of Robert Peston, Kevin Anderson and Rory Cellan-Jones have played a key role in showing skeptical journalists how engaging with the former audience on blogs can form a key part of the newsgathering process.

Unfortunately, many of those innovators later left the BBC, and the earlier experimentation was replaced with due process.

3. Backstage

While so many sing and dance about the APIs of The Guardian and The New York Times, Ian Forrester’s BBC Backstage project was well ahead of the game when it opened up the corporation’s API and started hosting hack days and meetups way back in 2005.

Backstage closed at the end of last year, just as the rest of the UK’s media were starting to catch up. You can read an e-book on its history here.

What else?

I’m sure you can add others – the iPlayer and their on-demand team; Special Reports; the UGC hub (the biggest in the world as far as I know); and even their continually evolving approach to linking (still not ideal, but at least they think about it) are just some that spring to mind. What parts of BBC Online have influenced or inspired you?

3 new resources for data journalists

There have been a raft of new sites for data launched in the past couple of months which I haven’t had time to blog about, so here’s a quick round-up:

  • Tim DaviesOpen Data Cookbook aims to collect “step by step recipes for practical ways to use open data” – a useful complement to GetTheData. The recipes are currently aimed at the more technically minded but you know what to do to address that…
  • Is It Open Data? aims to “make it easy for people to make enquires of data holders, about the openness of the data they hold — and to record publicly the results of those efforts.”
  • And for those wishing to publish open data, The Open Data Manual provides information on what open data is, why you should publish open data, and how to do it. If you come up against an organisation that does not know how to publish their data in an open format, or needs convincing of why they should do so, this is a good place to point them to (or learn the arguments from).

If you’ve seen any other useful resources of late, please post a link in the comments.

Why journalists should be lobbying over police.uk’s crime data

UK police crime maps

Conrad Quilty-Harper writes about the new crime data from the UK police force – and in the process adds another straw to the groaning camel’s back of the government’s so-called transparency agenda:

“It’s useless to residents wanting to find out what was going on at the house around the corner at 3am last night, and it’s useless to individuals who want to build mobile phone applications on top of the data (perhaps to get a chunk of that £6 billion industry open data is supposed to create).

“The site’s limitations are as follows:

  • No IDs for crimes: what if I want to check whether real life crimes have made it onto the map? Sorry.
  • Six crime categories: including “other crimes”, everything from drug dealing to bank robberies in one handy, impossible to understand category.
  • No live data: you mean I have to wait until the end of the next month to see this month’s criminality?!
  • No dates or times: funny how without dates and times I can’t tell which police manager was in charge.
  • Case status: the police know how many crimes go solved or unsolved, why not tell us this?”

This is why people are so concerned about the Public Data Corporation. This is why we need to be monitoring exactly what spending data councils release, and in what format. And this is why we need to continue to press for the expansion of FOI laws. This is what we should be doing. Are we?

UPDATE: Will Perrin has FOI’d all correspondence relating to ICO advice on the crime maps. Jonathan Raper has a list of further flaws including:

  • Some data such as sexual offences and murder is removed – even though it would be easy to discover and locate from other police reports.
  • Data covers reported crimes rather than convictions, so some of it may turn out not to be crime.
  • The levels of policing are not provided, so that two areas with the “same” crime levels may in fact have “radically different” experiences of crime and policing.

Charles Arthur notes that: “Police forces have indicated that whenever a new set of data is uploaded – probably each month – the previous set will be removed from public view, making comparisons impossible unless outside developers actively store it.”

Louise Kidney says:

“What we’ve actually got with http://www.police.uk is neither one nor the other. Ruth looks like a crime overlord cos of all the crimes happening in her garden and we haven’t got exact point data, but we haven’t got first part of postcode data either e.g. BB5 crimes or NW1 crimes. Instead, we’ve got this weird halfway house thing where it’s not accurate, but its inaccuracy almost renders it useless because we don’t have any idea if every force uses the same parameters when picking these points, we don’t know how they pick their points, we don’t know what we don’t know in terms of whether one house in particular is causing a considerable issue with anti-social behaviour for example, allowing me to go to my local Council and demand they do something about it.”

Adrian Short argues that “What we’re looking at here isn’t a value-neutral scientific exercise in helping people to live their daily lives a little more easily, it’s an explicitly political attempt to shape the terms of a debate around the most fundamental changes in British policing in our lifetimes.”

He adds:

“It’s derived data that’s already been classified, rounded and lumped together in various ways, with a bit of location anonymising thrown in for good measure. I haven’t had a detailed look at it yet but I would caution against trying to use it for anything serious. A whole set of decisions have already transformed the raw source data (individual crime reports) into this derived dataset and you can’t undo them. You’ll just have to work within those decisions and stay extremely conscious that everything you produce with it will be prefixed, “as far as we can tell”.

“£300K for this? There ought to be a law against it.”

UPDATE 2: One frustrated developer has launched CrimeSearch.co.uk to provide “helpful information about crime and policing in your area, without costing 300k of tax payers’ money”