 Bella Hurrell is the Specials Editor with BBC News Online. I asked her how data journalism was affecting their work for a forthcoming article. Here is her response in full:
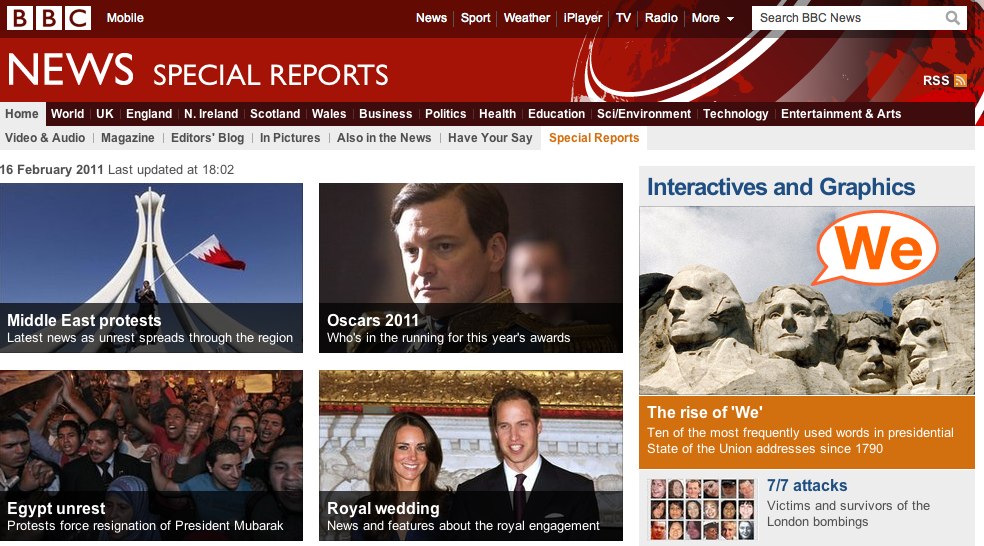
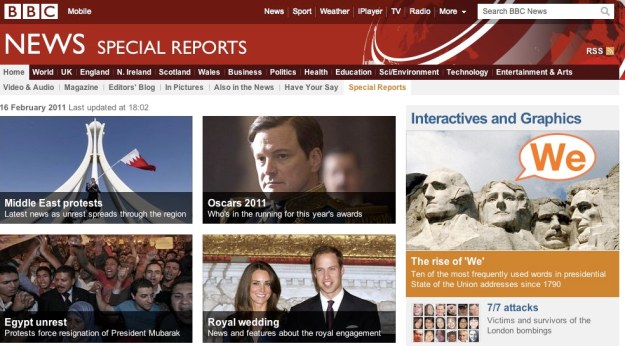
The BBC news specials team produces multimedia interactives, daily graphics as well as more complex data visualisations. The team consists of journalists, designers and developers all working closely together, sitting alongside each other.
We have found that proximity really important to the success of projects. Although we have done this for a while, increasingly other organisations are reorganising along these lines after coming to realise the benefits of breaking down silos and co-locating people with different skillsets can produce more innovative solutions at a faster pace.
As data visualisation has come into the zeitgeist, and we have started using it more regularly in our story-telling, journalists and designers on the specials team have become much more proficient at using basic spreadsheet applications like Excel or Google Docs. We’ve boosted these and other skills through in house training or external summer schools and conferences.
Data as a service, data as a story
There are two interrelated elements to data journalism: firstly data as a service, often involving publicly available data. The school league tables which the BBC news website has produced every year for over a decade are an example here. We know they are hugely popular and they provide a valuable public service for users. More recently the government has started to get better at putting data / information online, so we have adjusted our coverage. Instead of replicating what is done by government sites (such as providing individual school pages) we try to provide value by doing something extra, such as mini charts and the ability to select and compare schools – as well as news stories and analysis.
The second element is data as a story. The simple fact that loads of data has been published is not really very interesting to most people. Data is only useful if it is personal – I want to find out about schools in my area, restaurants near me and so on – or when it reveals something remarkable. The duck pond debacle from MPs expenses data or the Iraq civilian death records kept by the US revealed by Wikileaks’ release of the Iraq war documents are both examples of individual stories from big tranches of data that really resonated.
Dealing with large numbers of documents
With data stories that involve thousands of documents we face two challenges. Firstly deciding whether we can provide a platform or tool for people to look at the documents or data. This can be valuable but might involve significant technical resources and may not be worth doing if others are already providing this service.
Secondly we need to find the stories and then report them but clearly that can be tricky when there are thousands of documents to examine. Crowdsourcing is an obvious approach but we need to use what the crowd tells us. When readers told us about potential stories they spotted in the MPs expenses data we pulled in our whole politics team off normal duties to sift users’ questions and put them directly to the relevant MPs. Then we published their answers on our site. This is a very resource heavy approach and not sustainable over a long time.
Another model for reporting stories that involve large sets of data was Panorama’s public sector pay story, where the website partnered with the investigative unit to tell the story online. The Panorama team spent months collecting data and we provided simple visualisations and a way for users to examine the data.