Paul teaches data journalism at Birmingham City University and is the author of a number of books and book chapters about online journalism and the internet, including the Online Journalism Handbook, Mobile-First Journalism, Finding Stories in Spreadsheets, Data Journalism Heist and Scraping for Journalists.
From 2010-2015 he was a Visiting Professor in Online Journalism at City University London and from 2009-2014 he ran Help Me Investigate, an award-winning platform for collaborative investigative journalism. Since 2015 he has worked with the BBC England and BBC Shared Data Units based in Birmingham, UK. He also advises and delivers training to a number of media organisations.
When making video for the web there are four broad roles that it is likely to play: it might illustrate a story; add to it; distil the story; or tell it.
In the video below, made for students on the MA in Multiplatform and Mobile Journalism at Birmingham City University, I talk through examples of each type of video, as well as some tips on considering variety of shots, and sequence. You can find links to the examples below.
If you’re using maps as a data journalist it’s important to be aware of the editorial choices you are making — and how they can skew your reporting.
In this video — first made for students on the MA in Data Journalism at Birmingham City University and shared as part of a series of video posts — I introduce critical cartography, the different types of maps you might choose to use to tell a story, and the different types of stories that they can tell.
I also give some examples of geography-based stories that might be better told with other charts, and list some tools and tips that can be used to tell geographical stories.
With just a few basic data journalism techniques you can tell a lot of data journalism stories. I call these the “three chords of data journalism” — a nod to Simon Rogers’s talk on data journalists as the new punks. Those chords are: sorting; filtering; and calculating percentages.
In this third video first made for students on the MA in Data Journalism at Birmingham City University and shared as part of a series of video posts, I walk through how to use those techniques in practice, using gender pay gap data to demonstrate how those techniques can be used to find outliers and potential interviewees; to drill down to a particular category or area in a dataset; and to put figures into context.
Journalists get hold of data using four broad approaches: it might be newly published or issued; it might be leaked; they might request it; or they might seek it out based on an idea or in reaction to a news event.
In this second short video first made for students on the MA in Data Journalism at Birmingham City University and shared as part of a series of video posts, I go through the different ways that journalists obtain data and the different types of story that those sources can lead to.
Data journalism isn’t just about spreadsheets and interactives: in this video from my MA Data Journalism classes at Birmingham City University I look at why the news industry has expanded its focus on data journalism over the past decade, and how thinking about definitions of data journalism can help reporters think more broadly about potential stories and subjects beyond official statistics.
I also look at related terms such as computational journalism, robot journalism and augmented journalism — and what we can learn from those definitions as practitioners.
This is part of a series of videos recorded during the coronavirus pandemic.
The best online journalism has a range of qualities: it tends to be succinct, easy to scan, and it considers how a user might interact with it — whether through links or embedded elements, or more conversational elements like comments and social media hashtags.
Email newsletters are an excellent way for journalism students to build a profile in a field while also improving their specialist knowledge and editorial skills. I’ve put together a short video guide on some of the key techniques to use when starting an email newsletter — and why it’s a great way to stand out in the jobs market.
The video outlines three typical purposes of newsletters, the importance of visuals and links, and other key qualities of the genre. Watch it below.
This video was first made for journalism students on Birmingham City University’s MA in Multiplatform and Mobile Journalism. It also includes some advice on referencing reading and evidence in an evaluation of students’ work.
If you follow me on Twitter you’ll know every so often I highlight a story which uses company accounts. This latest one has celebrity and fashion, and involves a charity that’s raising money through star-studded events — what more can you ask for?
🧵It's time for another journey into the world of telling stories through company accounts – this time Naomi Campbell's fashion charity is under investigation! The story is here: https://t.co/iRvYuDbTbF But how did the reporter find the details..?
While researching my post on developing curiosity in journalism I came across Terry Heick‘s 4 stages of curiosity. It outlines 4 steps that learners go through as they grapple with new knowledge: firstly finding out what they are expected to do (the process); then understanding the content involved; then how to transfer that to particular situations; and finally how it applies to, and changes, them.
But the same model can also be adapted to provide a framework for investigations. Here’s how:
In an extract from a new chapter in the ebook Finding Stories in Spreadsheets, I explain what regular expressions are — and how they can be used to extract information from spreadsheets.The ebook version of this tutorial includes a dataset and exercise to employ these techniques.
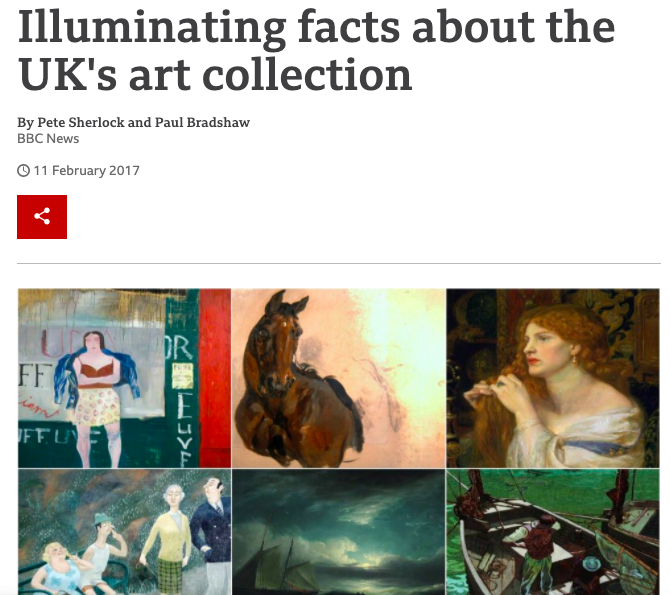
The story was an unusual one: the BBC Data Unit had been given access to a dataset on more than 200,000 works of art in galleries across the UK. What patterns could we find in the data that would allow us to tell a story about the nature of the nation’s paintings?
Some of the data was straightforward to work with: the ‘artist’ column was relatively clean, and allowed us to identify the most common male and female artist. It turned out that the latter – the Victorian botanist Marianne North – was relatively unknown. So, that was one story we could tell.
But other parts of the data were more problematic. The date column, for example, contained inconsistently formatted data: in the majority of cases a specific year had been entered, but in many others the data contained text such as “18th century” or “1900-1920” or “1800s”.
We also noticed that monarchs featured heavily in the art – but understandably there was no column that was specifically dedicated to classifying those. If we wanted to identify the most-painted monarchs we would have to create new data that somehow extracted those names from the paintings’ titles.
These problems – extracting data from existing data, particular text data – are what regular expressions are designed for. In this chapter I will explain what regular expressions are, and how to use them in spreadsheets.