Women represent 49.5% of the world’s population, but they do not have a corresponding public, political and social influence. In recent years, more and more women have raised their voices, making society aware of their challenges — data journalists included. To commemorate International Women’s Day, Carla Pedret presentsa list of data journalism projects that detail the sacrifices, injustices and prejudices that women still have to face in the 21st century.
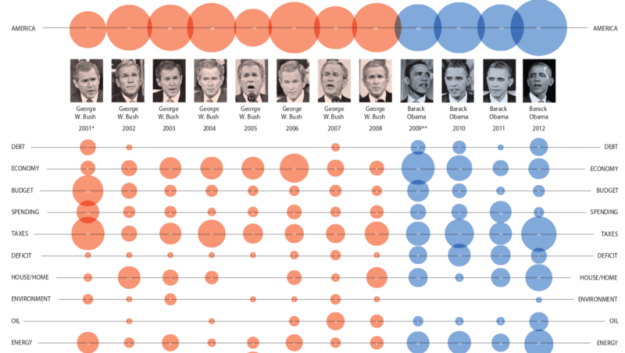
In a guest post for OJB, Barbara Maseda looks at how the media has used text-as-data to cover State of the Union addresses over the last decade.
State of the Union (SOTU) addresses are amply covered by the media —from traditional news reports and full transcripts, to summaries and highlights. But like other events involving speeches, SOTU addresses are also analyzable using natural language processing (NLP) techniques to identify and extract newsworthy patterns.
Every year, a new speech is added to this small collection of texts, which some newsrooms process to add a fresh angle to the avalanche of coverage.
Bombings in Barcelona in 1938 (Image by Italian Airforce under CC)
In a guest post for OJB, Carla Pedret looks at a new data journalism project to catalogue what happened during the Spanish Civil War.
125,000 people died, disappeared or were repressed in the Spanish Civil War (1936-1939) and during the Franco dictatorship, according to historians. Many of their families still do not know, 40 years later, what exactly happened to them.
It’s always difficult to get publishers to agree to things like this, so if you have any comments or feedback that I can use to make a similar case to publishers in future, please let me know in the comments.
The latest in my series of FAQ posts comes from the National University of Sciences & Technology (NUST) in Pakistan. As always, I’m publishing my answers to their questions here in case it’s of use to anyone else.
Q. What would you say to convince journalists — especially journalists working in developing countries where even the acquisition of public records is often a tedious task — about the importance of data journalism?
If you believe that journalism has a duty to be factual, accurate, and to engage an audience in subjects which have a clear public and civic importance, then data journalism is going to be very important to your work. Continue reading →
Megan Lucero of the Bureau Local – photo: Jonny Jacobsen
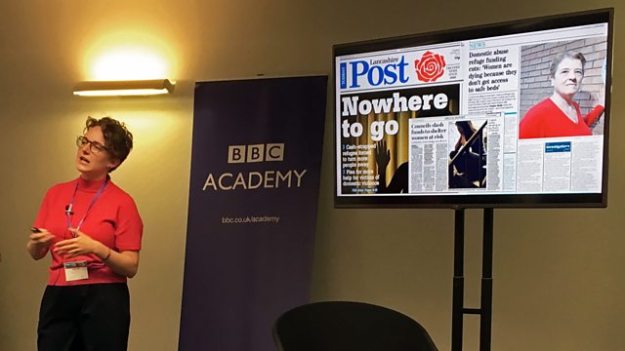
Last week I hosted the second annual Data Journalism UK conference — a convenient excuse to bring together speakers from the news media, industry experts, charities and startups working in the field. You can read write ups on Journalism.co.ukand the BBC Academy website (who kindly hosted the event at BBC Birmingham), but I thought I’d also put my own thoughts down here…
The Bureau and the BBC: 2 networked models for supporting data journalism
2017 saw the launch of two projects with a remit to generate and stimulate data journalism at a local level: the Bureau of Investigative Journalism’s Bureau Local project, and the BBC’s Shared Data Unit. Continue reading →
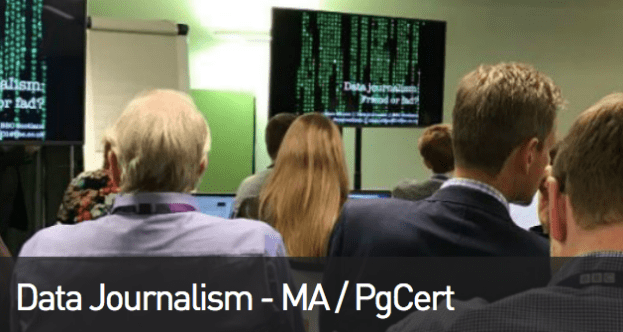
Earlier this year I announced a new MA in Data Journalism. Now I am announcing a version of the course for those who wish to study a shorter, part time version of the course.
Law, Regulation and Institutions (including security); and
Specialist Journalism, Investigations and Coding
The modules develop both a broad understanding of a range of data journalism techniques before you choose to develop some of those in greater depth on a specialist project.
The course is designed for those working in industry who wish to gain accredited skills in data journalism, but who cannot take time out to study full time or may not want a full Masters degree (a PGCert is 60 credits towards the 180 credits needed for a full MA).
Students on the PGCert can also apply to work with partner organisations including The Telegraph, Trinity Mirror and Haymarket brands including FourFourTwo.
In a special guest post Anders Eriksen from the #bord4editorial development and data journalism team at Norwegian news website Bergens Tidende talks about how they manage large data projects.
Do you really know how you ended up with those results after analyzing the data from Public Source?
Well, often we did not. This is what we knew:
We had downloaded some data in Excel format.
We did some magic cleaning of the data in Excel.
We did some manual alterations of wrong or wrongly formatted data.
We sorted, grouped, pivoted, and eureka! We had a story!
Then we got a new and updated batch of the same data. Or the editor wanted to check how we ended up with those numbers, that story.
…And so the problems start to appear.
How could we do the exact same analysis over and over again on different batches of data?
And how could we explain to curious readers and editors exactly how we ended up with those numbers or that graph?
We needed a way to structure our data analysis and make it traceable, reusable and documented. This post will show you how. We will not teach you how to code, but maybe inspire you to learn that in the process. Continue reading →