APIs can be very useful sources of data for data journalists. In this video — first made for students on the MA in Data Journalism at Birmingham City University and shared as part of a series of video posts — I explain what an API is and how they have been used in a variety of data-driven stories.
Writing for social media is a different skill to writing news articles, or even writing headlines. In this video I explain key techniques in shortform storytelling, such as the importance of quotes and numbers, images and video, as well as examples of narrative structures used in tweets and threads.
The video includes the following checklist to use with any piece of social media writing:
Notebooks are one of the ways that data journalists document their work, and make it transparent for others to follow and reproduce. In this video — first made for students on the MA in Data Journalism at Birmingham City University and shared as part of a series of video posts — I explain what notebooks are and walk through how to create one in RStudio.
R — along with Python and JavaScript — is one of the most popular programming languages used by data journalists. In this video — first made for students on the MA in Data Journalism at Birmingham City University and shared as part of a series of video posts — I explain what R is and why you might choose to use it rather than spreadsheets alone, or other languages, in your work.
Oh, and a quick caveat: since Colab notebooks were added to Google Drive, I now prefer Python — but it’s a personal thing, and most of this video can be applied to either language.
The talk by FiveThirtyEight’s Andrew Flowers mentioned in this video can be found here.
Search engine optimisation (SEO) is the skill of making it easier for people to find your article when they’re looking for the story, or issue, online. In this video I explain some key techniques in optimising your writing for findability, some of the jargon involved in SEO, and three ‘levels’ that you need to consider in optimising content.
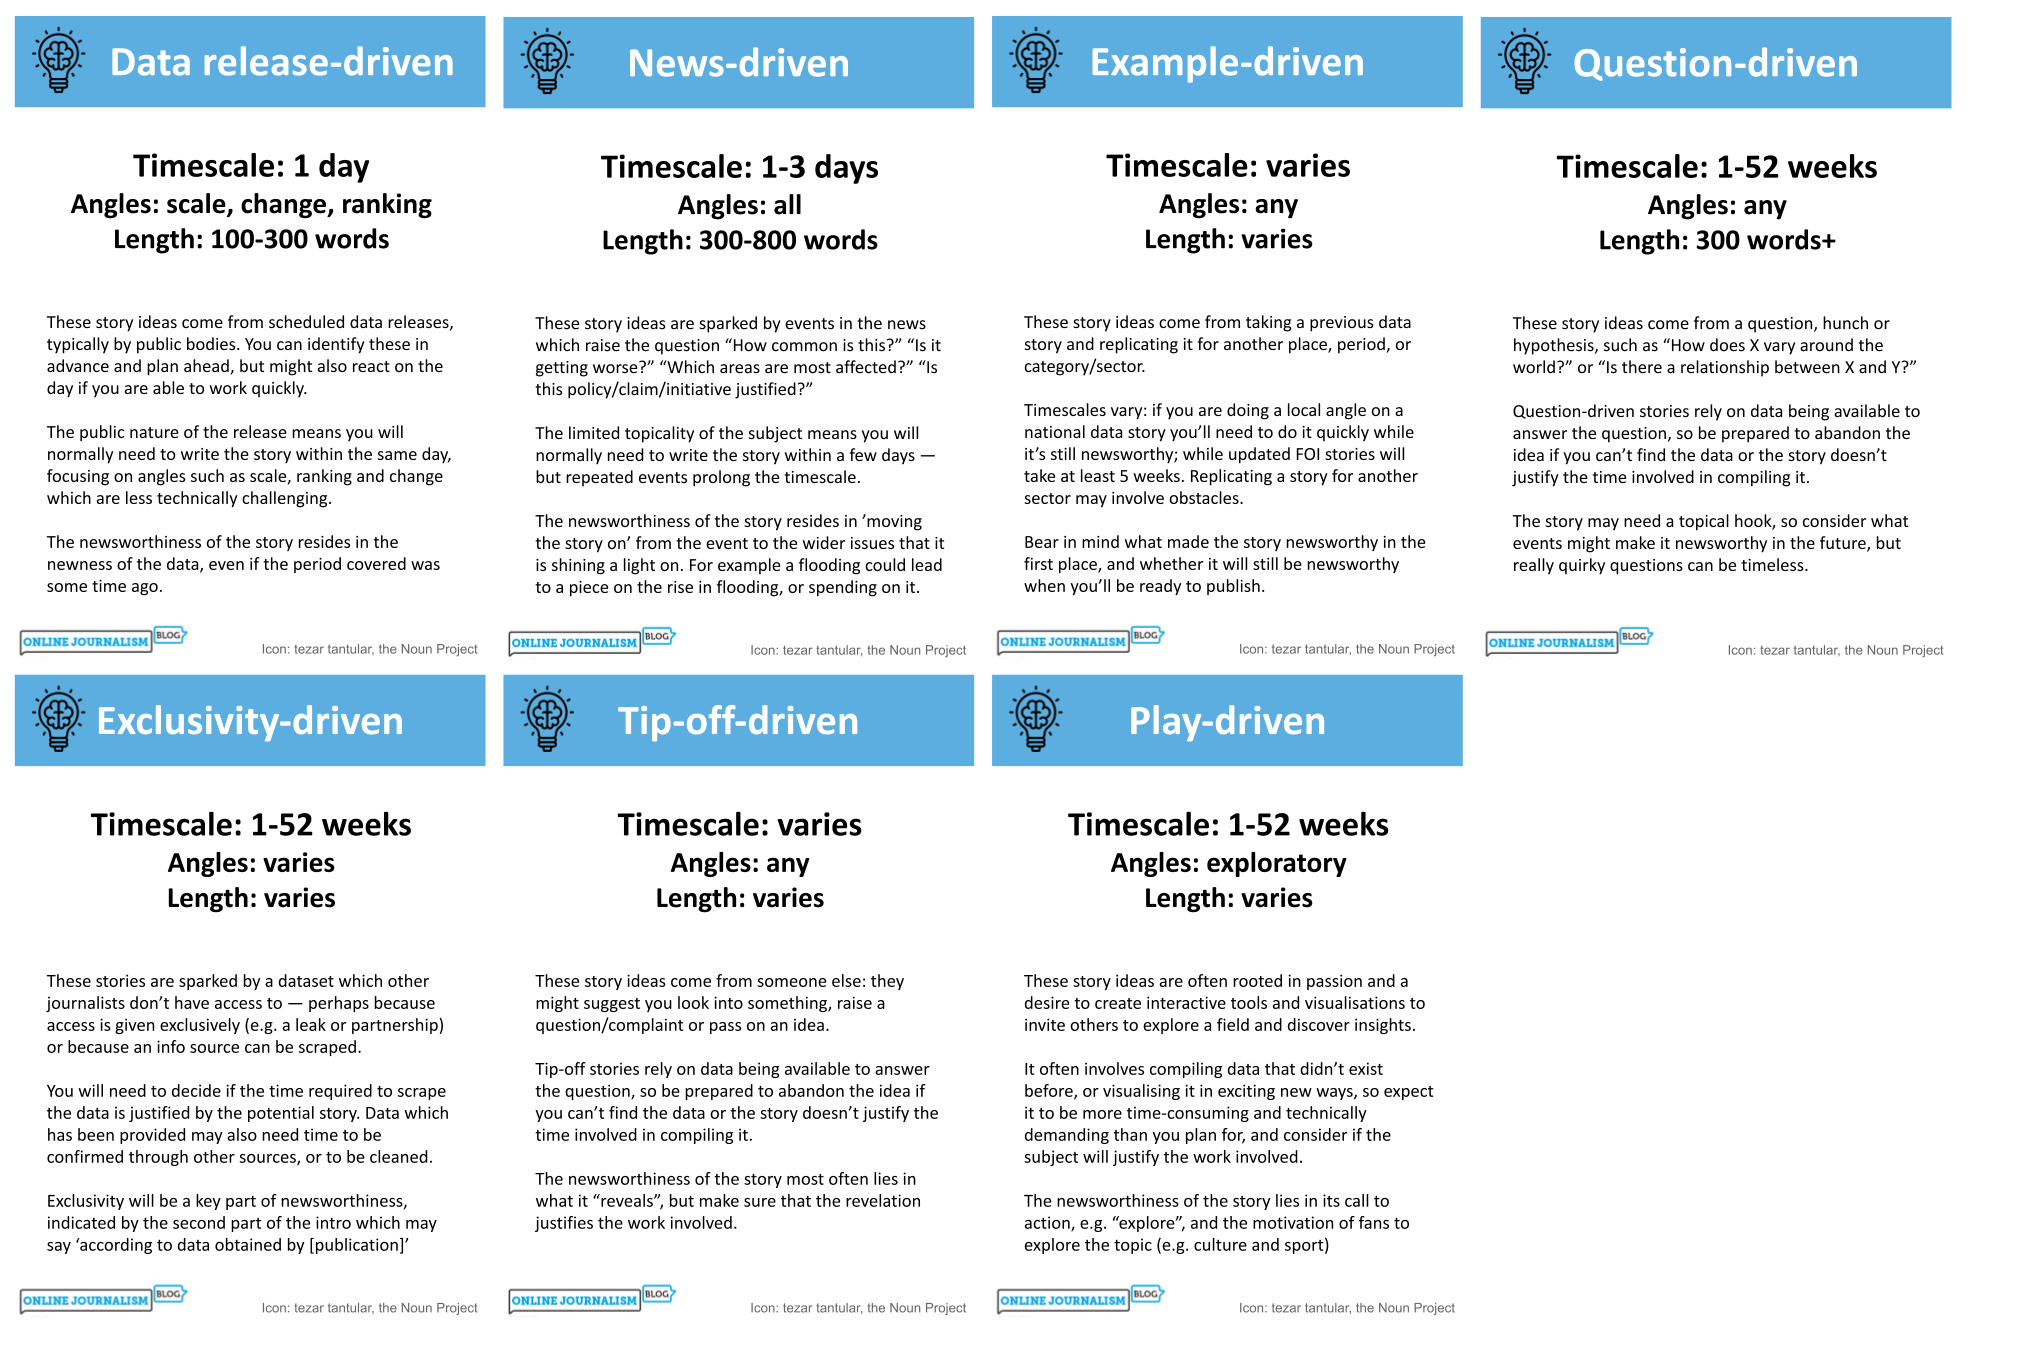
As part of the process I also created a series of cards, available as a printable PDF, which you can use to prompt these ideas in a classroom or editorial brainstorming situation. Please let me know if you find them useful!
In a fifth video post on narrative concepts* I build on some of the ideas about structure in the third post, exploring Freytag’s Pyramid and the kabob as narrative devices for structuring longer stories — and the role of genre in learning how to write in a new format.
In particular, I look at the interview format and different generic techniques such as headline styles and standfirsts — and I look at immersive longform stories and the new genre of scrollytelling.
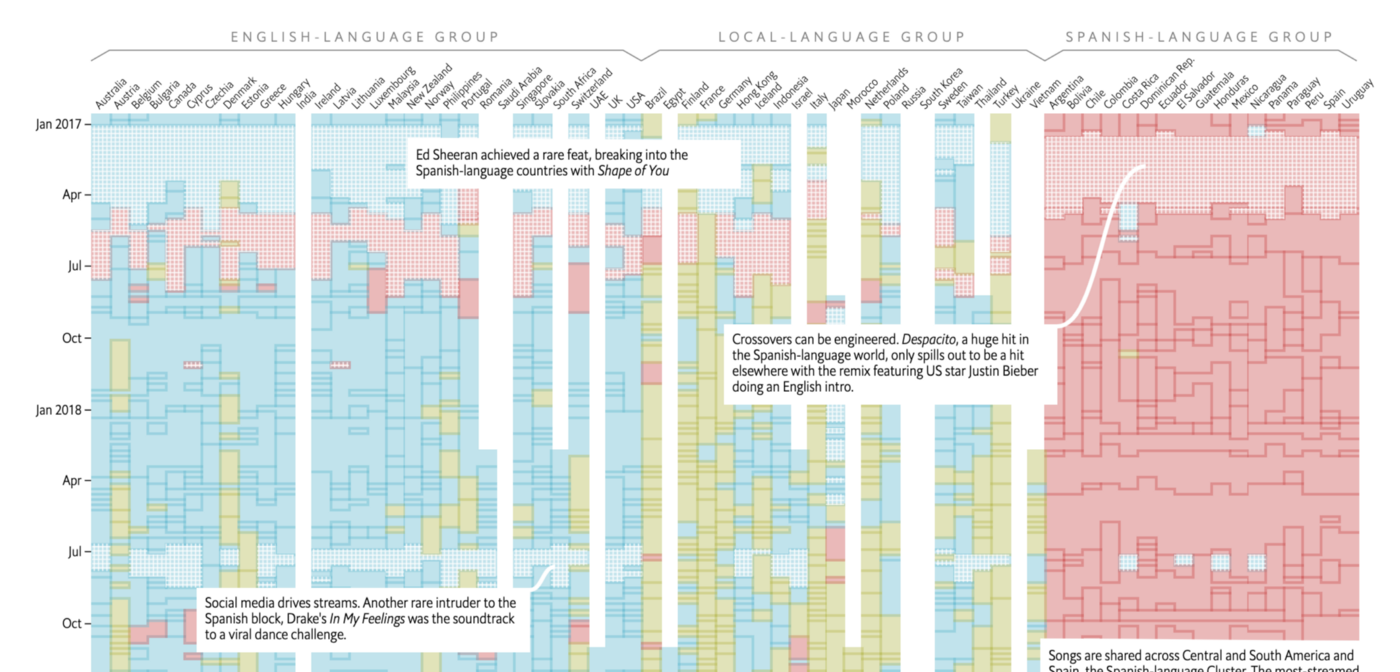
Earlier this year The Economist team published an interactive analysis delving into 5 years of Spotify’s data in 70 countries. It was a large data project that started with a scraper — by data journalist Dolly Setton, who was interested in the role of language on the platform — but getting the data was just the beginning.
“I thought it was an interesting experience at the beginning, exploring and figuring out together what was the heart of the piece,” says Olivia. “We didn’t realise what the story was going to be until sort of midway through.”
In a fourth video post on narrative concepts* I look at the different ways temporality can be used in factual storytelling, different choices that can be made about the narrator, and the principle of showing rather than telling.
In the latest video post on narrative concepts (you can see the previoustwo here), this video looks at narrative structure — in particular, how Cortazzi‘s typical narrative structure can help us identify common patterns across different journalistic formats, from the inverted pyramid to the WSJ feature formula.
Being able to identify these structures means we can adapt more quickly to new formats — including those on new platforms.
The video also touches on the use of temporality in storytelling, and how stories might jump back and forth in time to keep readers engaged.