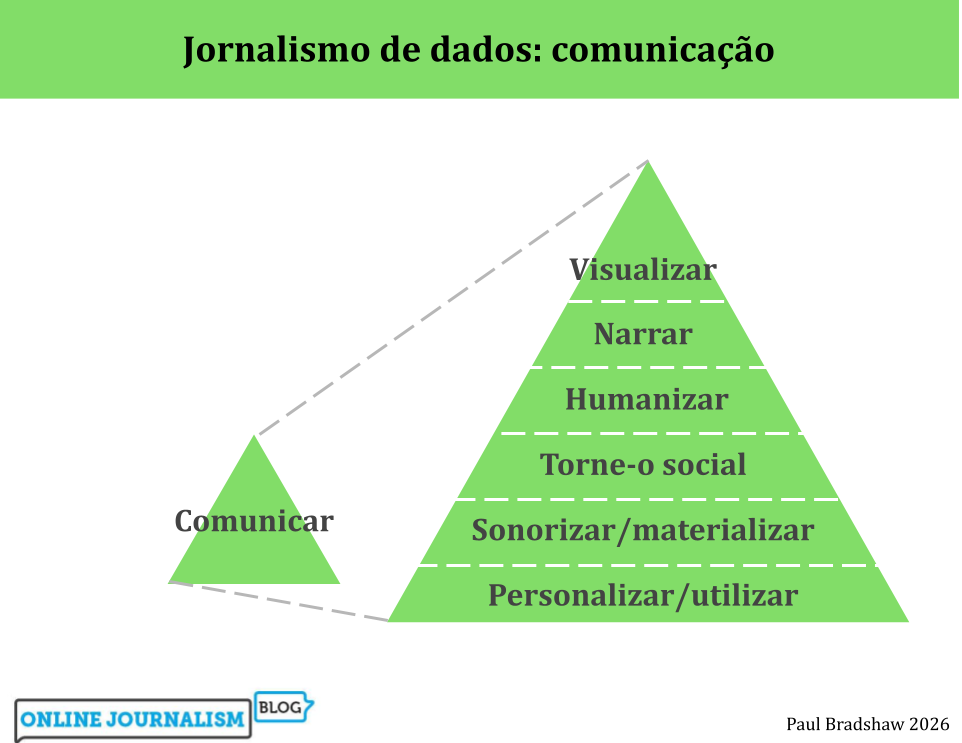
A pirâmide invertida do jornalismo de dados mapeia o processo de utilização de dados na reportagem, desde a geração de ideias, passando pela limpeza, contextualização e combinação, até à comunicação. A fase final — a comunicação — apresenta uma série de opções: desde a visualização e sonificação até à personalização e ferramentas. Mas quais são as melhores práticas para cada uma?
A visualização é normalmente a forma mais rápida de comunicar os resultados do jornalismo de dados: ferramentas gratuitas como Datawrapper e Flourish muitas vezes exigem apenas que você carregue os seus dados e escolha entre várias opções de visualização.
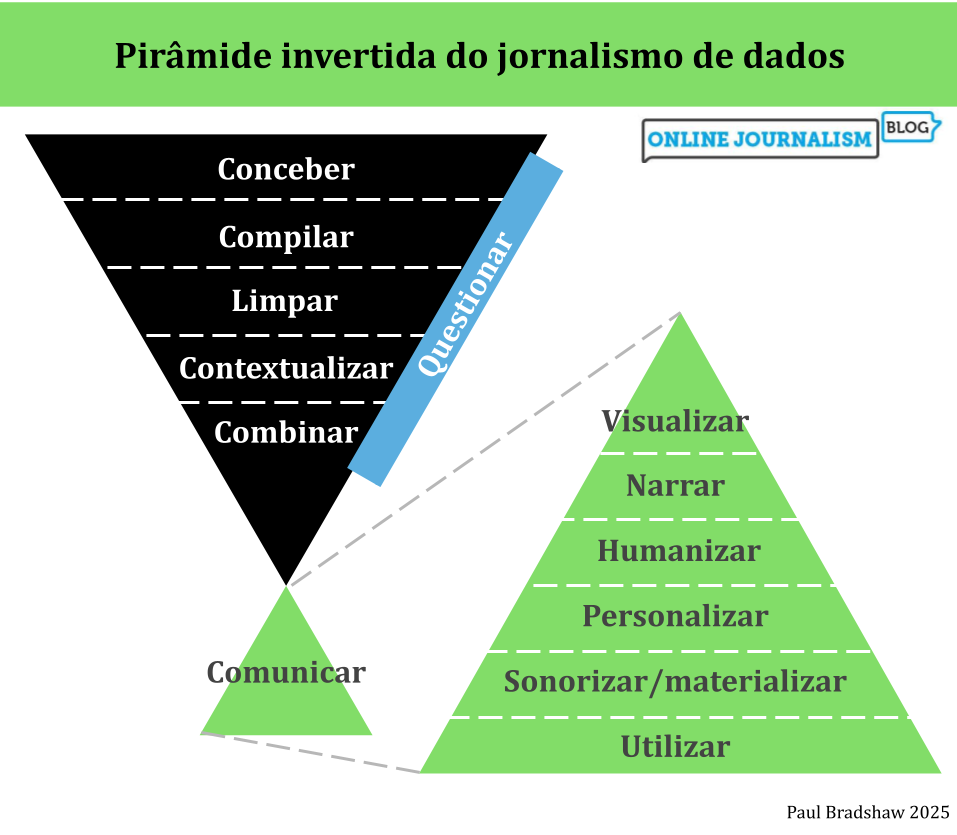
Os projetos de jornalismo de dados envolvem várias etapas, cada uma apresentando seus próprios desafios. Para ajudar a compreendê-las, criei o que chamei de ‘Pirâmide Invertida do Jornalismo de Dados’. Ela delineia as etapas que precisam ser consideradas à medida que a matéria avança desde a conceção inicial até a comunicação dos resultados, e como elas se relacionam entre si. Abaixo, explico cada etapa, identifico questões a considerar conforme o projeto avança e ofereço conselhos e dicas sobre como enfrentá-las.
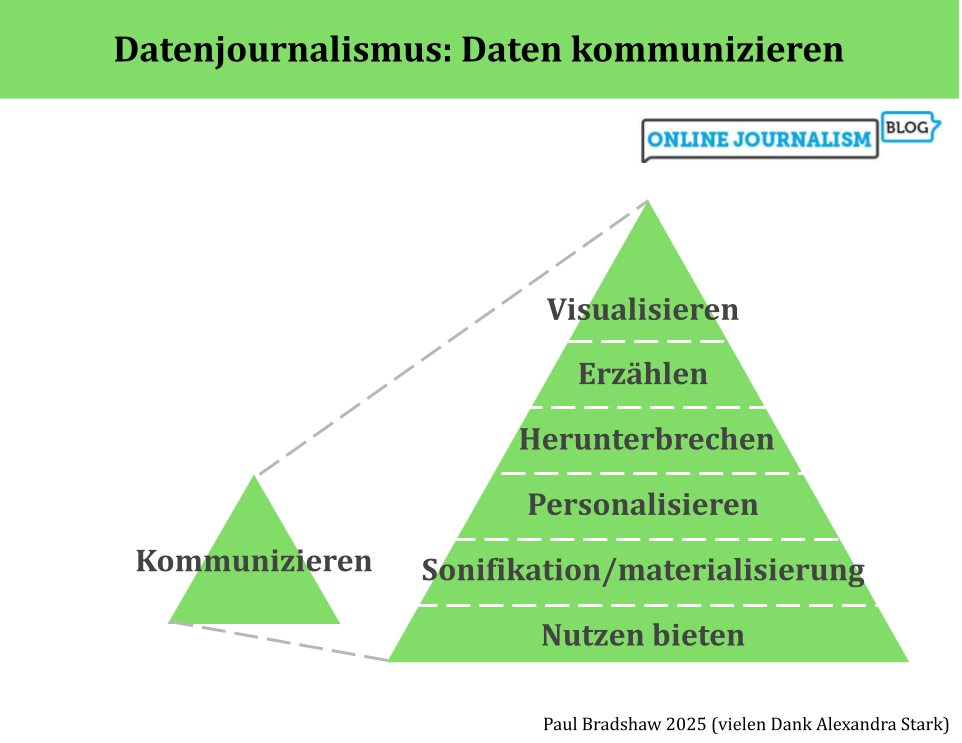
Die umgekehrte Pyramide des Datenjournalismus bildet den Prozess der Datennutzung in der Berichterstattung ab, von der Ideenentwicklung über die Bereinigung, Kontextualisierung und Kombination bis hin zur Kommunikation. In dieser letzten Phase – der Kommunikation – sollten wir einen Schritt zurücktreten und unsere Optionen betrachten: von Visualisierung und Erzählung bis hin zu Personalisierung und Werkzeugen.
Visualisierung kann ein schneller Weg sein, die Ergebnisse des Datenjournalismus zu vermitteln: Kostenlose Tools wie Datawrapper und Flourish erfordern oft nur, dass du deinen Daten hochlädst und aus verschiedenen Visualisierungsoptionen auswählst.
In a previous post I explored how AI performed on data analysis tasks — and the importance of understanding the code that it used to do so. If you do understand code, here are some tips for using large language models (LLMs) for analysis — and addressing the risks of doing so.
The most basic change to the Inverted Pyramid of Data Journalism is the recognition of a stage that precedes all others — idea generation — labelled ‘Conceive’ in the diagram above.
This is often a major stumbling block to people starting out with data journalism, and I’ve written a lot about it in recent years (see below for a full list).
The second major change is to make questioning more explicit as a process that (should) take place through all stages — not just in data analysis but in the way we question our sources, our ideas, and the reliability of the data itself.
A third change is to remove the ‘socialise‘ option from the communication pyramid: in conversation with Alexandra Stark I realised that this is covered sufficiently by the ‘utilise’ stage (i.e. making something useful socially).
Alongside the updated pyramid I’ve been using for the past few years I also wanted to round up links to a number of resources that relate to each stage. Here they are…
I was recently invited to speak to students at Tampere University in Finland, and had the opportunity — with the help of Esa Sirkkunen — to translate the ‘Inverted pyramid of data journalism‘ into Finnish. I’m sharing it here for anyone else who might find it useful.
The final workflow tip is all about efficiency. Computers deal with processes in a logical way, and good programming is often about completing processes in the simplest way possible.
If you have any tasks that are repetitive, break them down and work out what patterns might allow you to do them more quickly – or for a computer to do them. Continue reading →
En esta segunda parte Paul recorre 6 formas diferentes de comunicar en periodismo de datos que pueden ver en el cuadro de arriba y al final encontrarán un gráfico que resume toda la teoría (la cual está en desarrollo todavía y Bradshaw pide aportes, comentarios y sugerencias):
Pero ahora una vez más Paul Bradshaw nos trae un diagrama interesante para, en este caso, explicar el proceso de creación del periodismo de datos. Esta pirámide invertida del periodismo de datos muestra de forma simple como se avanza desde una gran cantidad de información que incrementalmente se va enfocando hasta llegar al punto de comunicar los resultados a la audiencia de la forma más clara posible. A continuación, la traducción del artículo donde podemos ver lasdiferentes etapas del proceso de data journalism: Continue reading →