Tag Archives: google refine

What is dirty data and how do I clean it? A great big guide for data journalists

Image: George Hodan

If you’re working with data as a journalist it won’t be long before you come across the phrases “dirty data” or “cleaning data“. The phrases cover a wide range of problems, and a variety of techniques for tackling them, so in this post I’m going to break down exactly what it is that makes data “dirty”, and the different cleaning strategies that a journalist might adopt in tackling them.

Four categories of dirty data problem

Look around for definitions of dirty data and the same three words will crop up: inaccurate, incomplete, or inconsistent.

Dirty data problems:
Inaccurate: Data stored as wrong type; Misentered data; Duplicate data; abbreviation and symbols.
Incomplete: Uncategorised; missing data.
Inconsistent: Inconsistency in naming of entities; mixed data
Incompatible data:  Wrong shape;
‘Dirty’ characters (e.g. unescaped HTML)

Inaccurate data includes duplicate or misentered information, or data which is stored as the wrong data type.

Incomplete data might only cover particular periods of time, specific areas, or categories — or be lacking categorisation entirely.

Inconsistent data might name the same entities in different ways or mix different types of data together.

To those three common terms I would also add a fourth: data that is simply incompatible with the questions or visualisation that we want to perform with it. One of the most common cleaning tasks in data journalism, for example, is ‘reshaping‘ data from long to wide, or vice versa, so that we can aggregate or filter along particular dimensions. (More on this later).

Continue reading

How to: convert XML or JSON into spreadsheets using Open Refine

curly brackets

Curly brackets pattern by Dan McCullough

One of the most useful applications of the data cleaning tool Open Refine (formerly Google Refine) is converting XML and JSON files into spreadsheets that you can interrogate in Excel.

Surprisingly, I’ve never blogged about it. Until now. Continue reading

How to: clean a converted PDF using Open Refine

Our initial table

This spreadsheet sent in response to an FOI request appeared to have been converted from PDF format

In a guest post post for OJB, Ion Mates explains how he used OpenRefine to clean up a spreadsheet which had been converted from PDF format. An earlier version of this post was published on his blog.

Journalists rarely get their hands on nice, tidy data: public bodies don’t have an interest in providing information in a structured form. So it is increasingly part of a journalist’s job to get that information into the right state before extracting patterns and stories.

A few months ago I sent a Freedom of Information request asking for the locations of all litter bins in Birmingham. But instead of sending a spreadsheet downloaded directly from their database, the spreadsheet they sent appeared to have been converted from a multiple-page PDF.

This meant all sorts of problems, from rows containing page numbers and repeated header rows, to information split across multiple rows and even pages.

In this post I’ll be taking you through I used the free data cleaning tool OpenRefine (formerly Google Refine) to tackle all these problems and create a clean version of the data. Continue reading

How to: combine multiple rows in a dataset where text is split across them (Open Refine)

When you’ve converted data from a PDF to a spreadsheet it’s not uncommon for text to end up being split across multiple rows, like this: text split across rows In this post I’ll explain how you can use Open Refine to quickly clean the data up so that the text is put back together and you have a single row for each entry. Continue reading

How to: clean up spreadsheet headings that run across multiple rows using Open Refine

Something that infuriates me often with government datasets is the promiscuous heading. This is when a spreadsheet doesn’t just have its headings across one row, but instead splits them across two, three or more rows.

To make matters worse, there are often also extra rows before the headings explaining the spreadsheet more generally. Here’s just one offender from the ONS:

A spreadsheet with promiscuous headings

A spreadsheet with promiscuous headings

To clean this up in Excel takes several steps – but Open Refine (formerly Google Refine) does this much more quickly. In this post I’m going to walk through the five minute process there that can save you unnecessary effort in Excel. Continue reading

A sample dirty dataset for trying out Google Refine

I’ve created this spreadsheet of ‘dirty data‘ to demonstrate some typical problems that data cleaning tools and techniques can be used for:

  • Subheadings that are only used once (and you need them in each row where they apply)
  • Odd characters that stand for something else (e.g. a space or ampersand)
  • Different entries that mean the same thing, either because they are lacking pieces of information, or have been mistyped, or inconsistently formatted

It’s best used alongside this post introducing basic features of Google Refine. But you can also use it to explore more simple techniques in spreadsheets like Find and replace; the TRIM function (and alternative solutions); and the functions UPPER, LOWER, and PROPER (which convert text into all upper case, lower case, and titlecase respectively).

Thanks to Eva Constantaras for suggesting the idea.

UPDATE: Peter Verweij has put together an introduction to some other cleaning techniques here.

Two reasons why every journalist should know about scraping (cross-posted)

This was originally published on Journalism.co.uk – cross-posted here for convenience.

Journalists rely on two sources of competitive advantage: being able to work faster than others, and being able to get more information than others. For both of these reasons, I  love scraping: it is both a great time-saver, and a great source of stories no one else has. Continue reading

Data Shaping in Google Refine – Generating New Rows from Multiple Values in a Single Column

One of the things I’ve kept stumbling over in Google Refine is how to use it to reshape a data set, so I had a little play last week and worked out a couple of new (to me) recipes.

The first relates to reshaping data by creating new rows based on columns. For example, suppose we have a data set that has rows relating to Olympics events, and columns relating to Medals, with cell entries detailing the country that won each medal type:

However, suppose that you need to get the data into a different shape – maybe one line per country with an additional column specifying the medal type. Something like this, for example:

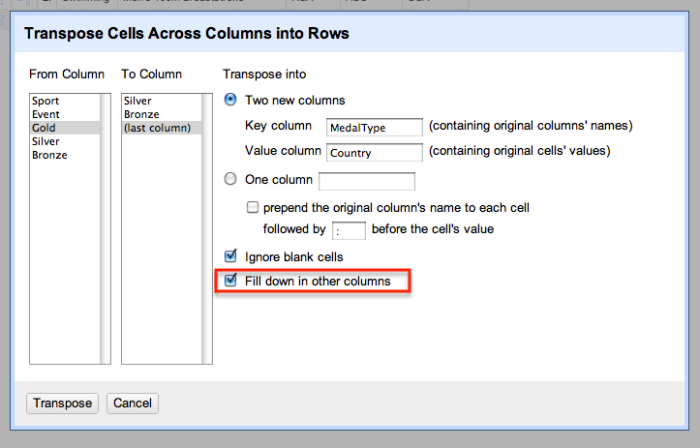
How can we generate that sort of view from the original data set? Here’s one way, that works when the columns you want to split into row values are contiguous (that is, next to each other). From the first column in the set of columns you want to be transformed, select Transpose > Transpose cells across columns into rows:

We now set the original selected column headers to be the cell value within a new column – MedalType – and the original cell values the value within a Country column:

(Note that we could also just transform the data into a single column. For example, suppose we had columns relating to courses currently taken by a particular student (Course 1, Course 2, Course 3), with a course code as cell value and one, two or three columns populated per student. If we wanted one row per student per course, we could just map the three columns onto a single column – CourseCode – and assign multiple rows to each student, then filtering out rows with a blank value in the CourseCOde column as required.)

Ticking the Fill down in other columns checkbox ensures that the appropriate Sport and Event values are copied in to the newly created rows:

Having worked out how to do that oft-required bit of data reshaping, I thought I could probably have another go at something that has been troubling me for ages – how to generate multiple rows from a single row where one of the columns contains JSON data (maybe pulled from a web service/API) that contains multiple items. This is a “mate in three” sort of problem, so here’s how I started to try to work it back. Given that I now know how to map columns onto rows, can I work out how to map different results in a JSON response onto different columns?

For example, here’s a result from the Facebook API for a search on a particular OU course code and the word open in a Facebook group name:

{“data”:[{“version”:1,”name”:”U101 (Open University) start date February 2012″,”id”:”325165900838311″},{“version”:1,”name”:”Open university, u101- design thinking, October 2011″,”id”:”250227311674865″},{“version”:1,”name”:”Feb 2011 Starters U101 Design Thinking – Open University”,”id”:”121552081246861″},{“version”:1,”name”:”Open University – U101 Design Thinking, Feburary 2011″,”id”:”167769429928476″}],”paging”:{“next”:…etc…}}

It returns a couple of results in the data element, in particular group name and group ID. Here’s one way I found of creating one row per group… Start off by creating a new column based on the JSON data column that parses the results in the data element into a list:

We can then iterate over the list items in this new column using the forEach grel command. The join command then joins the elements within each list item, specifically the group ID and name values in each result:

forEach(value.parseJson(),v,[v.id,v.name].join('||'))

You’ll notice that for multiple results, this produces a list of joined items, which we can also join together by extending the GREL expression:

forEach(value.parseJson(),v,[v.id,v.name].join('||')).join('::')

We now have a column that contains ‘||’ and ‘::’ separated items – :: separates individual group results from each other, || separates the id and name for each particular group.

Given we know how to create rows from multiple columns, we could try to split this column into separate columns using Edit column > Split into separate columns. This would create one column per result, which we could then transform into rows, as we did above. Whilst I don’t recommend this route in this particular case, here’s how we could go about doing it…

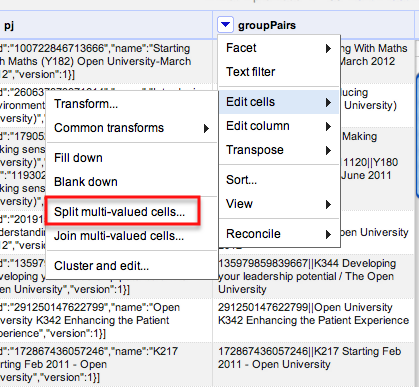
A far better approach is to use the Edit cells > split multi-valued cells option to automatically create new rows based on splitting the elements in a single column:

Note, however that this creates blanks in the other columns, so we need to Edit cells > Fill down to fill in the blanks in any other columns we want to refer to. After doing that, we end up with something like this:

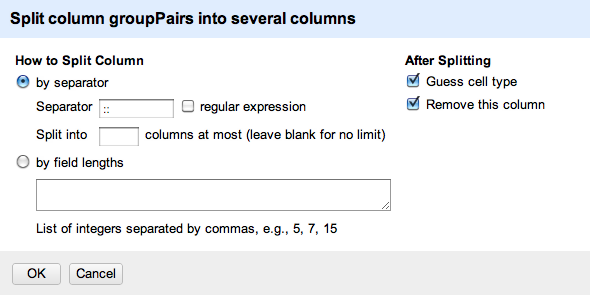
We could now split the groupPairs column using the || separator to create two columns – Group ID and group name – giving us one row per group, and separate columns identifying the course, group name and group ID.

If the above route seems a little complicated, fear not…Once you apply it, it starts to make sense!

SFTW: Scraping data with Google Refine

For the first Something For The Weekend of 2012 I want to tackle a common problem when you’re trying to scrape a collection of webpage: they have some sort of structure in their URL like this, where part of the URL refers to the name or code of an entity:

  1. http://www.ltscotland.org.uk/scottishschoolsonline/schools/freemealentitlement.asp?iSchoolID=5237521
  2. http://www.ltscotland.org.uk/scottishschoolsonline/schools/freemealentitlement.asp?iSchoolID=5237629
  3. http://www.ltscotland.org.uk/scottishschoolsonline/schools/freemealentitlement.asp?iSchoolID=5237823

In this instance, you can see that the URL is identical apart from a 7 digit code at the end: the ID of the school the data refers to.

There are a number of ways you could scrape this data. You could use Google Docs and the =importXML formula, but Google Docs will only let you use this 50 times on any one spreadsheet (you could copy the results and select Edit > Paste Special > Values Only and then use the formula a further 50 times if it’s not too many – here’s one I prepared earlier).

And you could use Scraperwiki to write a powerful scraper – but you need to understand enough coding to do so quickly (here’s a demo I prepared earlier).

A middle option is to use Google Refine, and here’s how you do it.

Assembling the ingredients

With the basic URL structure identified, we already have half of our ingredients. What we need  next is a list of the ID codes that we’re going to use to complete each URL.

An advanced search for “list seed number scottish schools filetype:xls” brings up a link to this spreadsheet (XLS) which gives us just that.

The spreadsheet will need editing: remove any rows you don’t need. This will reduce the time that the scraper will take in going through them. For example, if you’re only interested in one local authority, or one type of school, sort your spreadsheet so that you can delete those above or below them.

Now to combine  the ID codes with the base URL.

Bringing your data into Google Refine

Open Google Refine and create a new project with the edited spreadsheet containing the school IDs.

At the top of the school ID column click on the drop-down menu and select Edit column > Add column based on this column…

In the New column name box at the top call this ‘URL’.

In the Expression box type the following piece of GREL (Google Refine Expression Language):

http://www.ltscotland.org.uk/scottishschoolsonline/schools/freemealentitlement.asp?iSchoolID=”+value

(Type in the quotation marks yourself – if you’re copying them from a webpage you may have problems)

The ‘value’ bit means the value of each cell in the column you just selected. The plus sign adds it to the end of the URL in quotes.

In the Preview window you should see the results – you can even copy one of the resulting URLs and paste it into a browser to check it works. (On one occasion Google Refine added .0 to the end of the ID number, ruining the URL. You can solve this by changing ‘value’ to value.substring(0,7) – this extracts the first 7 characters of the ID number, omitting the ‘.0’) UPDATE: in the comment Thad suggests “perhaps, upon import of your spreadsheet of IDs, you forgot to uncheck the importer option to Parse as numbers?”

Click OK if you’re happy, and you should have a new column with a URL for each school ID.

Grabbing the HTML for each page

Now click on the top of this new URL column and select Edit column > Add column by fetching URLs…

In the New column name box at the top call this ‘HTML’.

All you need in the Expression window is ‘value’, so leave that as it is.

Click OK.

Google Refine will now go to each of those URLs and fetch the HTML contents. As we have a couple thousand rows here, this will take a long time – hours, depending on the speed of your computer and internet connection (it may not work at all if either isn’t very fast). So leave it running and come back to it later.

Extracting data from the raw HTML with parseHTML

When it’s finished you’ll have another column where each cell is a bunch of HTML. You’ll need to create a new column to extract what you need from that, and you’ll also need some GREL expressions explained here.

First you need to identify what data you want, and where it is in the HTML. To find it, right-click on one of the webpages containing the data, and search for a key phrase or figure that you want to extract. Around that data you want to find a HTML tag like <table class=”destinations”> or <div id=”statistics”>. Keep that open in another window while you tweak the expression we come onto below…

Back in Google Refine, at the top of the HTML column click on the drop-down menu and select Edit column > Add column based on this column…

In the New column name box at the top give it a name describing the data you’re going to pull out.

In the Expression box type the following piece of GREL (Google Refine Expression Language):

value.parseHtml().select(“table.destinations”)[0].select(“tr”).toString()

(Again, type the quotation marks yourself rather than copying them from here or you may have problems)

I’ll break down what this is doing:

value.parseHtml()

parse the HTML in each cell (value)

.select(“table.destinations”)

find a table with a class (.) of “destinations” (in the source HTML this reads <table class=”destinations”>. If it was <div id=”statistics”> then you would write .select(“div#statistics”) – the hash sign representing an ‘id’ and the full stop representing a ‘class’.

[0]

This zero in square brackets tells Refine to only grab the first table – a number 1 would indicate the second, and so on. This is because numbering (“indexing”) generally begins with zero in programming.

.select(“tr”)

Now, within that table, find anything within the tag <tr>

.toString()

And convert the results into a string of text.

The results of that expression in the Preview window should look something like this:

<tr> <th></th> <th>Abbotswell School</th> <th>Aberdeen City</th> <th>Scotland</th> </tr> <tr> <th>Percentage of pupils</th> <td>25.5%</td> <td>16.3%</td> <td>22.6%</td> </tr>

This is still HTML, but a much smaller and manageable chunk. You could, if you chose, now export it as a spreadsheet file and use various techniques to get rid of the tags (Find and Replace, for example) and split the data into separate columns (the =SPLIT formula, for example).

Or you could further tweak your GREL code in Refine to drill further into your data, like so:

value.parseHtml().select(“table.destinations”)[0].select(“td”)[0].toString()

Which would give you this:

<td>25.5%</td>

Or you can add the .substring function to strip out the HTML like so (assuming that the data you want is always 5 characters long):

value.parseHtml().select(“table.destinations”)[0].select(“td”)[0].toString().substring(5,10)

When you’re happy, click OK and you should have a new column for that data. You can repeat this for every piece of data you want to extract into a new column.

Then click Export in the upper right corner and save as a CSV or Excel file.

More on how this data was used on Help Me Investigate Education.

Social Interest Positioning – Visualising Facebook Friends’ Likes With Data Grabbed Using Google Refine

What do my Facebook friends have in common in terms of the things they have Liked, or in terms of their music or movie preferences? (And does this say anything about me?!) Here’s a recipe for visualising that data…

After discovering via Martin Hawksey that the recent (December, 2011) 2.5 release of Google Refine allows you to import JSON and XML feeds to bootstrap a new project, I wondered whether it would be able to pull in data from the Facebook API if I was logged in to Facebook (Google Refine does run in the browser after all…)

Looking through the Facebook API documentation whilst logged in to Facebook, it’s easy enough to find exemplar links to things like your friends list (https://graph.facebook.com/me/friends?access_token=A_LONG_JUMBLE_OF_LETTERS) or the list of likes someone has made (https://graph.facebook.com/me/likes?access_token=A_LONG_JUMBLE_OF_LETTERS); replacing me with the Facebook ID of one of your friends should pull down a list of their friends, or likes, etc.

(Note that validity of the access token is time limited, so you can’t grab a copy of the access token and hope to use the same one day after day.)

Grabbing the link to your friends on Facebook is simply a case of opening a new project, choosing to get the data from a Web Address, and then pasting in the friends list URL:

Google Refine - import Facebook friends list

Click on next, and Google Refine will download the data, which you can then parse as a JSON file, and from which you can identify individual record types:

Google Refine - import Facebook friends

If you click the highlighted selection, you should see the data that will be used to create your project:

Google Refine - click to view the data

You can now click on Create Project to start working on the data – the first thing I do is tidy up the column names:

Google Refine - rename columns

We can now work some magic – such as pulling in the Likes our friends have made. To do this, we need to create the URL for each friend’s Likes using their Facebook ID, and then pull the data down. We can use Google Refine to harvest this data for us by creating a new column containing the data pulled in from a URL built around the value of each cell in another column:

Google Refine - new column from URL

The Likes URL has the form https://graph.facebook.com/me/likes?access_token=A_LONG_JUMBLE_OF_LETTERS which we’ll tinker with as follows:

Google Refine - crafting URLs for new column creation

The throttle control tells Refine how often to make each call. I set this to 500ms (that is, half a second), so it takes a few minutes to pull in my couple of hundred or so friends (I don’t use Facebook a lot;-). I’m not sure what limit the Facebook API is happy with (if you hit it too fast (i.e. set the throttle time too low), you may find the Facebook API stops returning data to you for a cooling down period…)?

Having imported the data, you should find a new column:

Google Refine - new data imported

At this point, it is possible to generate a new column from each of the records/Likes in the imported data… in theory (or maybe not..). I found this caused Refine to hang though, so instead I exprted the data using the default Templating… export format, which produces some sort of JSON output…

I then used this Python script to generate a two column data file where each row contained a (new) unique identifier for each friend and the name of one of their likes:

import simplejson,csv

writer=csv.writer(open('fbliketest.csv','wb+'),quoting=csv.QUOTE_ALL)

fn='my-fb-friends-likes.txt'

data = simplejson.load(open(fn,'r'))
id=0
for d in data['rows']:
	id=id+1
	#'interests' is the column name containing the Likes data
	interests=simplejson.loads(d['interests'])
	for i in interests['data']:
		print str(id),i['name'],i['category']
		writer.writerow([str(id),i['name'].encode('ascii','ignore')])

[I think this R script, in answer to a related @mhawksey Stack Overflow question, also does the trick: R: Building a list from matching values in a data.frame]

I could then import this data into Gephi and use it to generate a network diagram of what they commonly liked:

Sketching common likes amongst my facebook friends

Rather than returning Likes, I could equally have pulled back lists of the movies, music or books they like, their own friends lists (permissions settings allowing), etc etc, and then generated friends’ interest maps on that basis.

[See also: Getting Started With The Gephi Network Visualisation App – My Facebook Network, Part I and how to visualise Google+ networks]

PS dropping out of Google Refine and into a Python script is a bit clunky, I have to admit. What would be nice would be to be able to do something like a “create new rows with new column from column” pattern that would let you set up an iterator through the contents of each of the cells in the column you want to generate the new column from, and for each pass of the iterator: 1) duplicate the original data row to create a new row; 2) add a new column; 3) populate the cell with the contents of the current iteration state. Or something like that…

PPS Related to the PS request, there is a sort of related feature in the 2.5 release of Google Refine that lets you merge data from across rows with a common key into a newly shaped data set: Key/value Columnize. Seeing this, it got me wondering what a fusion of Google Refine and RStudio might be like (or even just R support within Google Refine?)

PPPS this could be interesting – looks like you can test to see if a friendship exists given two Facebook user IDs.