Category Archives: online journalism

Journalism Reloaded – What journalists need for the future

In a guest post Alexandra StarkSwiss journalist and Head of Studies at MAZ – the Swiss School of Journalismargues that it’s time for journalists to take action on business models for supporting journalism. Stark proposes a broadened set of skills and a new structure to enable greater involvement from journalists, while also fostering further teaching of such skills.

Ask a journalist if his or her job will remain important in the future: “Of course,” he or she will answer while privately thinking, “What a stupid question!” Try changing this stupid question just a bit, asking: “How will it be possible that you’ll still be able to do a good job in the future?” It’s likely you won’t receive an answer at all. Continue reading

‘Chunking’ online content? Don’t assume we start at the same point

Online multimedia production has for a few years now come with the guidance to ‘chunk’ content: instead of producing linear content, as you would for a space in a linear broadcast schedule, you split your content into specific chunks of material that each tackles a different aspect of the issue or story being covered. Interfaces like these show the idea in practice best:

Being a Black Man interactive

The concept is particularly well explained by Mindy McAdams (on text), and Andy Dickinson (on video, below): Continue reading

Finding images and multimedia for your news project (without breaking copyright laws)

For copyright reasons image is not available (badge)

Whether you need an image for your blog post, a soundtrack to your video or that YouTube clip for your documentary, if you’re dealing with multimedia it’s likely you’ll end up using – or wanting to use – someone else’s work as part of your own.

Here are some basic tips on finding and using multimedia across the web in a way that won’t (hopefully) land you in hot water.

The public domain myth

One of the mistakes that has repeatedly landed journalists and their employers in trouble is confusion over the term “public domain“.

Public domain has two possible meanings. In copyright terms, public domain refers to work whose copyright has expired, meaning that anyone can use it without having to ask the copyright holder. Disney – a fierce lobbyist itself for extending copyright – has used ‘public domain’ material as the basis for most of its cartoons, from the work of the Grimm Brothers to a host of other fairy tales, myths and legends.

But sometimes you will hear journalists talk about something being “in the public domain“, in other words ‘public’. For instance, when the Irish Daily Mail published photos of an air traffic controller from her website, they defended the decision on the grounds that the image was “in the public domain”.

But this is not the same.

For example, pretty much every piece of media, almost by definition, is “in the public domain”. Newspapers and magazines sit on the newsstands; television and radio reports are broadcast on huge city centre screens and speakers.

But if you take that content and reproduce it in its entirety without permission, you are breaking copyright law.

The $7,500 copyright scam

If you need any persuading about this, read this post about a copyright scam whereby images are pushed to the top of Google Images search results pages, and then bloggers sued for using them without permission.

It seems odd that media organisations so used to protecting their own, very public, content, should think that another person’s photo, or video, or report, should be fair game because it is “in the public domain”. But they do.

If you want public domain (in the sense of ‘copyright expired’) content, there are some useful sources. The Public Domain Review, for example, publishes a range of public domain work and has this guide to finding them. And Angela Grant writes here about finding public domain video, among other things (note that Angela refers to US law, not that of other countries).

But never assume something is public domain because it is “in public”.

One point to make: while an image, story, or composition may be out of copyright, its performance, re-design or re-telling may not.

Just ask Disney.

Creative Commons – making UGC copyright explicit

If you’re dealing with content that’s been published on a platform like Flickr or YouTube, you may be able to find out the copyright status of that content relatively easily.

Both allow users to easily establish copyright through the Creative Commons licence. You can either look for that licence in the relevant part of the page hosting the content.

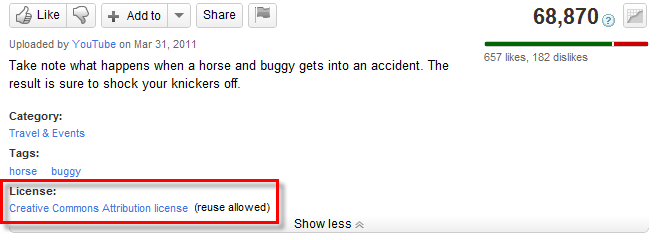
On YouTube it is under the video:

Where to find a YouTube video's licensing information - image from YouTube. Click to see original in context.

Where to find a YouTube video’s licensing information – image from YouTube.

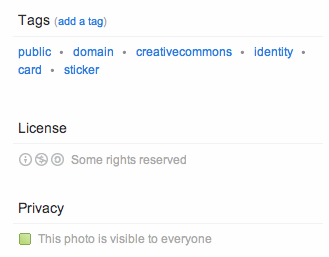
On Flickr this is on the right hand side under License:

Look for an image’s licensing information on Flickr on the right hand column. Make sure you click on that licence to find out what terms it requires.

Look for an image’s licensing information on Flickr on the right hand column.

Make sure you click on that licence to find out what terms it requires.

Creative Commons, for example, has a number of elements:

  • Whether the material can be used only in noncommercial contexts, or for commercial use as well
  • Whether the material can be adapted and changed, or must be left unchanged
  • Whether you must use the same CC licence if you use this material (e.g. you cannot use a noncommercial licence but then allow your work to be used commercially)
  • Whether you must attribute the work (this is where many people breach the licence)

If you’re unsure of where your work fits against those criteria (for example, whether it’s considered as “commercial”), then approach the copyright holder for clarity. Remember that the CC licence is only a default position, and can be negotiated. Also, if you cannot get any response and decide to publish anyway, your attempts to contact the copyright holder will be important if there are any legal proceedings.

If you want others to publish their content under a CC licence, it helps if you publish at least some of your own work under a CC licence too. Indeed, if it contains other CC material, their licences may require you to.

Flickr and YouTube aren’t the only sites that use Creative Commons licences, of course. To search for media under a CC licence (including on those sites), use the search facility on the Creative Commons site and select the engine you want to search through.

If you’re running a hyperlocal site, or any site that needs images of places, check out Geograph, which hosts Creative Commons-licensed images of locations around the UK.

There are also specialist sites for sharing music under CC, such as Freesound.

Even if the media you are interested in using does not use a CC licence, of course, you can still approach the copyright holder for permission to use it.

Attribution does not cover you for copyright

Another mistake that some people make is to believe that simply linking to the source, or naming the photographer/source, is enough to avoid copyright issues.

This is only the case if the licence for the material says so.

Copyright has two elements: moral rights, and economic rights.

The moral right is the right to be identified as the author of a piece of work. This is the attribution which is in pretty much every copyright licence, Creative Commons or otherwise.

But it’s not the right that most people sue over.

The economic right is the right to right to “allow or prevent the copying of their work or the performance of their work in public” (IPO). This translates into the ability to earn money from a piece of work. And this is what people largely sue over.

Attributing a photo only covers the moral right. It does not mean you won’t be sued.

If, then, you have used an image, video or audio without the permission of the rights holder (granted through a Creative Commons licence or directly to you through correspondence) then you are still probably breaking copyright law.

Embedding versus re-broadcasting

If the media is hosted on a platform like YouTube, you may be able to embed it on a webpage without seeking permission at all: if the creator* has enabled embedding then they would have little argument in suing for breach of copyright because:

  • By enabling embedding they have given an ‘implied’ right; and
  • They could stop you publishing it instantly by disabling embedding.
  • Also, your embedding of their media would not lead to any loss of revenue (as advertising can be embedded too), so it is unlikely that there would be any damages to sue for.

*note: this does not apply to video created by other people and uploaded by someone other than the copyright holder.

UPDATE: Interestingly on this note, in March 2014 Getty Images made it possible to embed 35 million of its images for non-commercial use:

“In essence, anyone will be able to visit Getty Images’ library of content, select an image and copy an embed HTML code to use that image on their own websites. Getty Images will serve the image in a embedded player – very much like YouTube currently does with its videos – which will include the full copyright information and a link back to the image’s dedicated licensing page on the Getty Images website.”

Reality bites

Of course, it’s one thing to talk about the strict legal position, and another to talk about what actually happens. Journalists regularly publish content that breaks the law – but make a judgement about the likelihood of ending up in court over that. For example, I can say that the Queen is corrupt (a defamatory statement) and be almost certain that the Queen is not going to sue me (because she has a history of not doing so).

Media lawyers are not just there to advise publishers on their strict legal position, but on the balance of risk involved, and how to reduce those risks. While you cannot always avoid risks, you can avoid them in simple ways:

  • Always try to establish the copyright situation regarding any media you use: who holds the copyright (there may be more than one copyright owner: for example, performer and composer), and what are the terms of the licence?
  • Try to contact the copyright holder if you’re in any doubt – even if you can’t contact them your efforts to do so will help you if you do end up in court.
  • Always attribute authorship and link to the source (this can be done in title credits, captions and/or links on the host webpage). Copyright claims normally revolve around loss of earnings: anything that may have contributed to that (i.e. not linking to the source) will likely add to damages.

Minimal cost and royalty free

‘Royalty free’ is a vague term which is often confused with, simply, ‘free’. It most often refers to media which is paid for once and can then be used multiple times in different contexts.

For example, you might pay for a CD of ‘royalty free’ music or sound effects which can be used across multiple video projects – saving you the hassle of acquiring permissions every time for different music.

Or you might buy a CD of royalty free images (clip art, for example) that you can use across various design projects.

If you’re studying in a school of media, or working in a large media organisation, they will probably have some royalty free media for students or employees to use – so ask around to find out what’s available.

But don’t use it for the sake of it: the quality can vary. In addition, many other media projects may have relied on the same libraries, so you can lose distinctiveness.

You should also be aware that the licences of even so-called ‘royalty free’ material can be restrictive: the Wikipedia entry on royalty free music notes that “the royalty-free music license at SmartSound states “You must obtain a “mechanical” license for replication of quantities in excess of 10,000 units.” (Read the licence here)

Thankfully for those who want more diversity, the internet has made new types of royalty free media – and new pricing – possible, as a wider range of photographers and other media creators can now sell their work through online marketplaces.

Pond5 has sound effects, photos, video, illustrations, music and even After Effects projects from $2 up – as well as occasional free materialiStockphoto covers most of those, and adds Flash files too – again at often very cheap prices. Quality, however, does cost more.

Stock.XCHNG deserves special mention, boasting that it is the world’s “leading free stock photo site” and hosting thousands of royalty free images. Even if the image is ‘free’, however, it’s only free under the terms of the licence – so always check them.

You can find many more sources by searching for articles like this on the ‘best places to get free images’.

On the audio front, there are sites like Audiosocket, which allow you to browse and licence independent music for your film (if you use Vimeo you can also add this through their music store).

If you know of other sources or issues to consider in finding material for multimedia, I’d love to know.

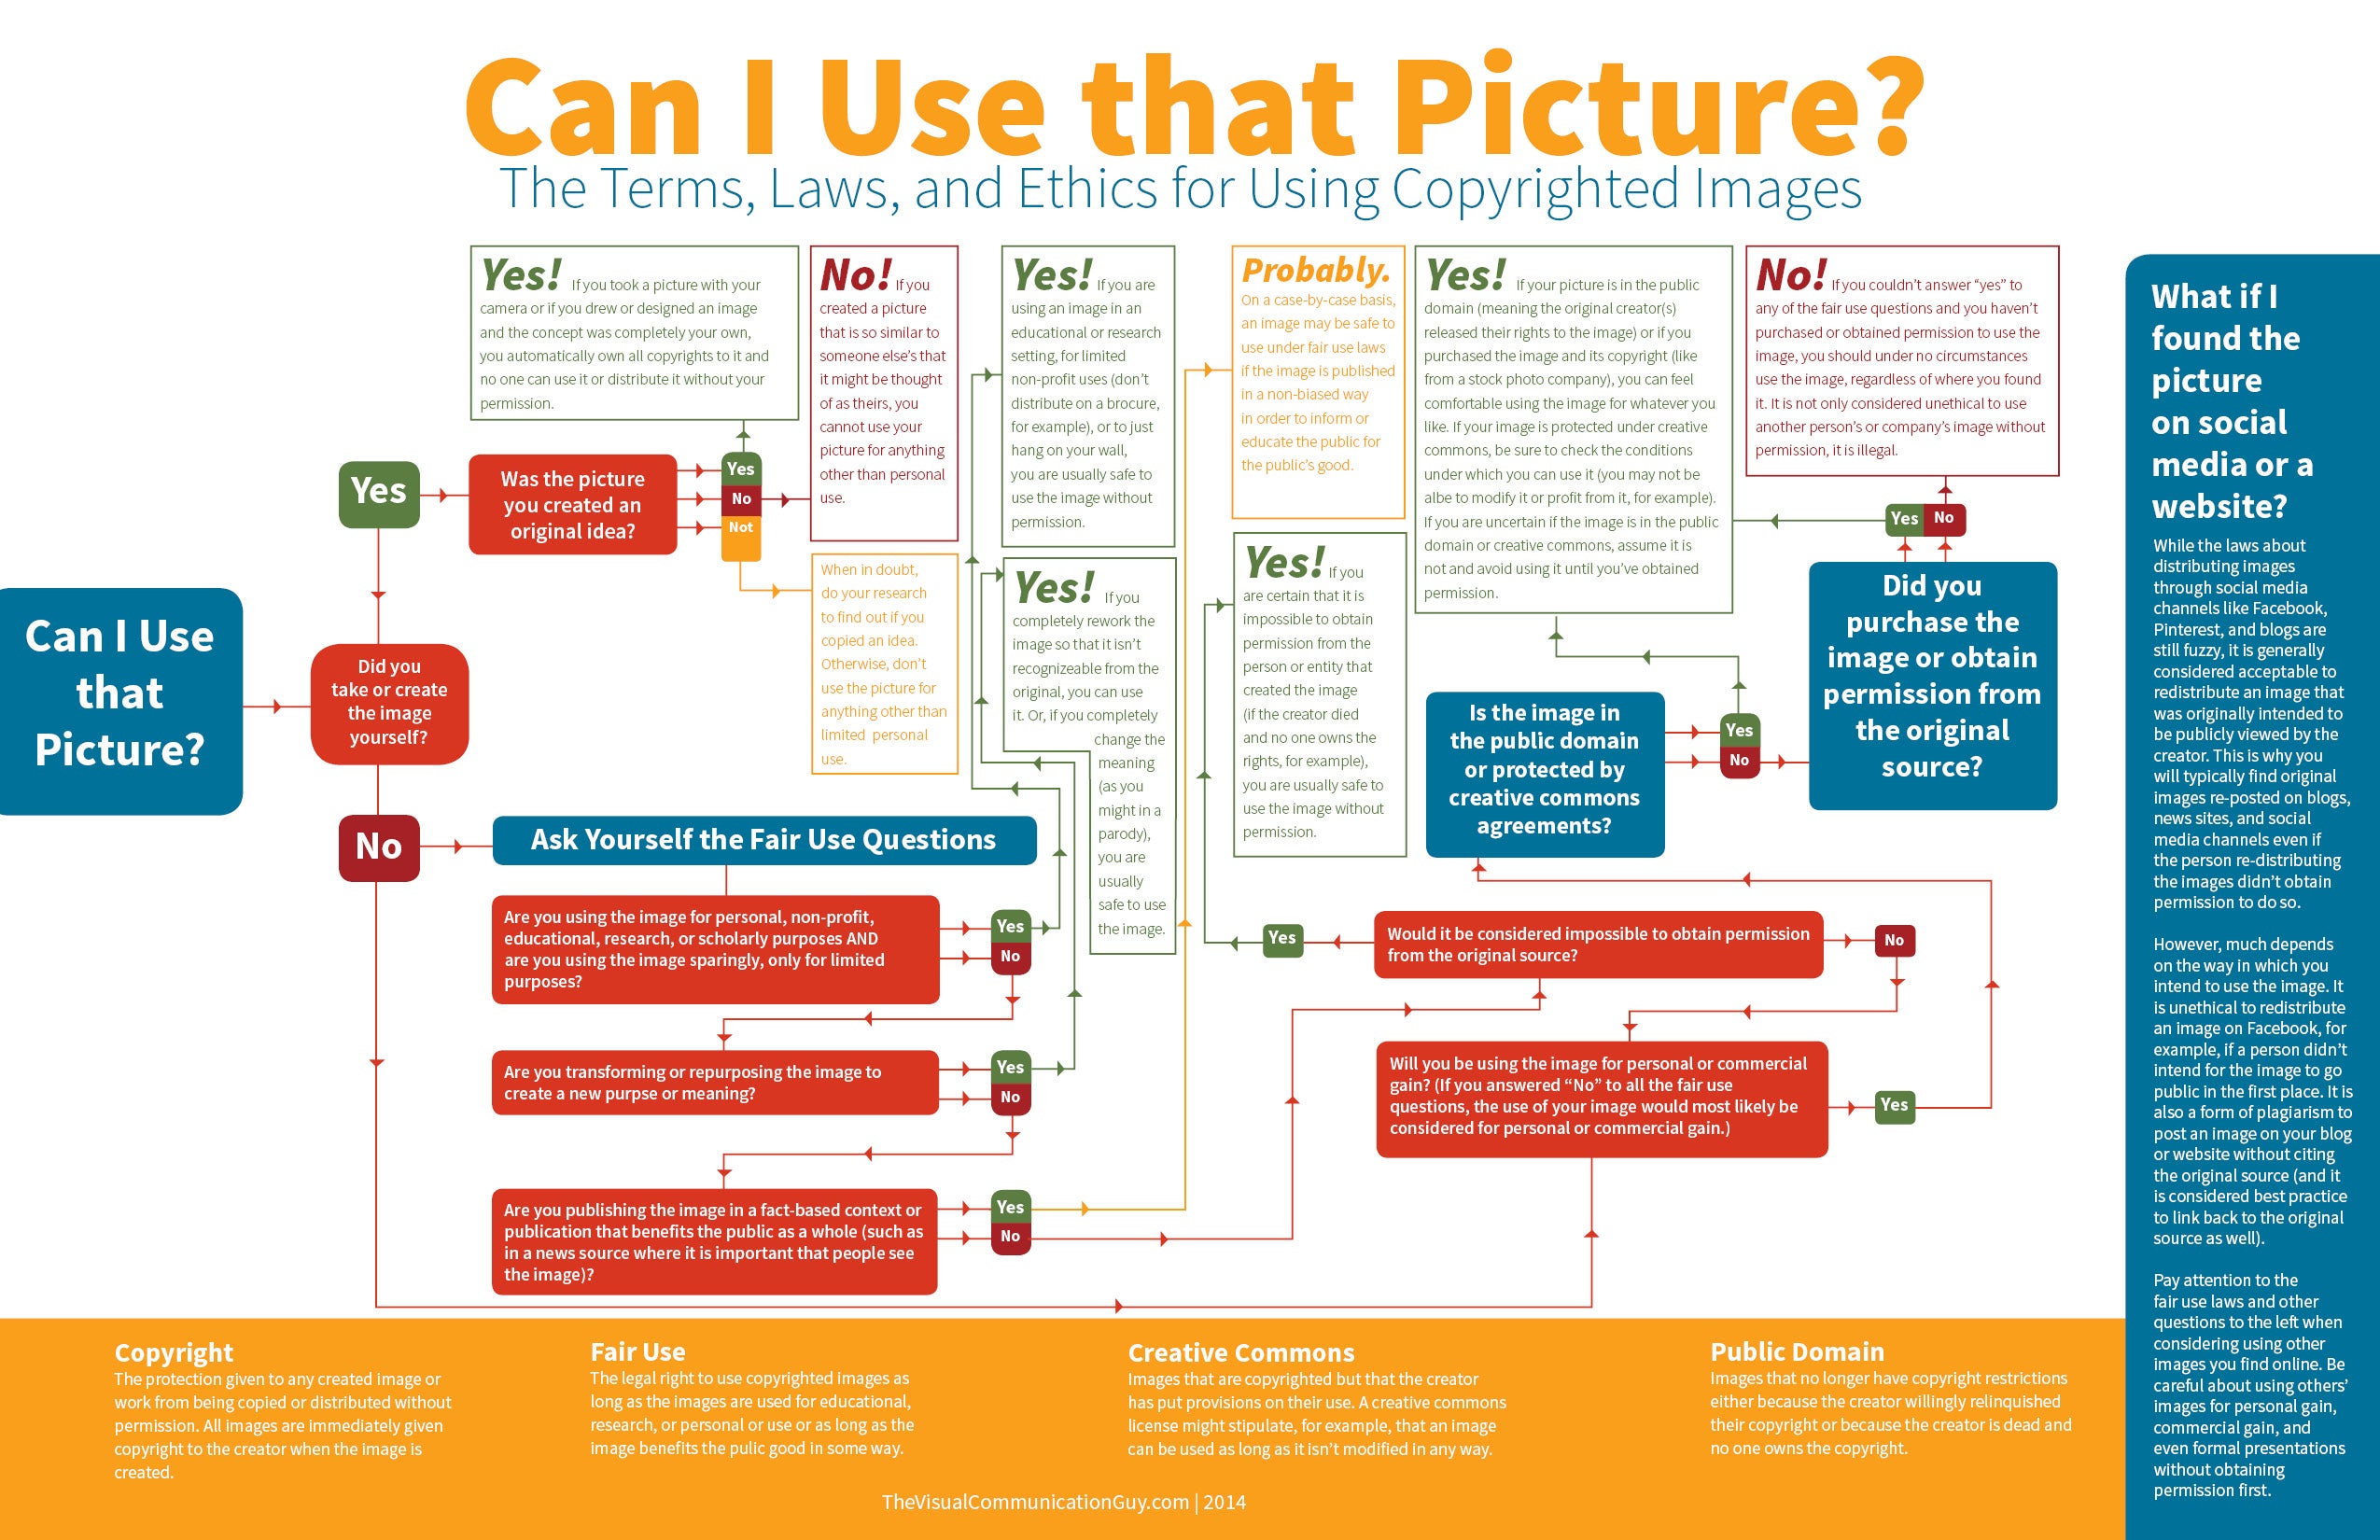
UPDATE: Here’s a useful flow chart on copyright via Mau Gris – although note that this is based on US law, which is more forgiving on images used for satirical purposes.

Can I Use that Picture? by The Visual Communication Guy via Visually

Can I Use that Picture? by The Visual Communication Guy via Visually & Lifehacker – click for full size

For more on these issues, and for related tools and links, see my bookmarks at http://delicious.com/paulb/creativecommons

Working With Excel Spreadsheet Files Without Using Excel…

One of the most frequently encountered ways of sharing small datasets is in the form of Excel spreadsheet (.xls) files, notwithstanding all that can be said In Praise of CSV😉 The natural application for opening these files is Microsoft Excel, but what if you don’t have a copy of Excel available?

There are other desktop office suites that can open spreadsheet files, of course, such as Open Office. As long as they’re not too big, spreadsheet files can also be uploaded to and then opened using a variety of online services, such as Google Spreadsheets, Google Fusion Tables or Zoho Sheet. But spreadsheet applications aren’t the only data wrangling tools that can be used to open xls files… Here are a couple more that should be part of every data wrangler’s toolbox…

(If you want to play along, the file I’m going to play with is a spreadsheet containing the names and locations of GP practices in England. The file can be found on the NHS Indicators portal – here’s the actual spreadsheet.)

Firstly, Google Refine. Google Refine is a cross-platform, browser based tool that helps with many of the chores relating to getting a dataset tidied up so that you can use it elsewhere, as well as helping out with data reconcilation or augmenting rows with annotations provided by separate online services. You can also use it as a quick-and-dirty tool for opening an xls spreadsheet from a URL, knocking the data into shape, and dumping it to a CSV file that you can use elsewhere. To start with, choose the option to create a project by importing a file from a web address (the XLS spreadsheet URL):

Once loaded, you get a preview view..

You can tidy up the data that you are going to use in your project via the preview panel. In this case, I’m going to ignore the leading lines and just generate a dataset that I can export directly as a CSV file once I’ve got the data into my project.

If I then create a project around this dataset, I can trivially export it again using a format of my own preference:

So that’s one way of using Google Refine as a simple file converter service that allows you to preview and to a certain extent shape the data in XLS spreadsheet, as well as converting it to other file types.

The second approach I want to mention is to use a really handy Python software library (xlrd – Excel Reader) in Scraperwiki. The Scraperwiki tutorial on Excel scraping gives a great example of how to get started, which I cribbed wholesale to produce the following snippet.

import scraperwiki
import xlrd

#cribbing https://scraperwiki.com/docs/python/python_excel_guide/
def cellval(cell):
    if cell.ctype == xlrd.XL_CELL_EMPTY:    return None
    return cell.value

def dropper(table):
    if table!='':
        try: scraperwiki.sqlite.execute('drop table "'+table+'"')
        except: pass

def reGrabber():
    #dropper('GPpracticeLookup')
    url = 'https://indicators.ic.nhs.uk/download/GP%20Practice%20data/summaries/demography/Practice%20Addresses%20Final.xls'
    xlbin = scraperwiki.scrape(url)
    book = xlrd.open_workbook(file_contents=xlbin)

    sheet = book.sheet_by_index(0)        

    keys = sheet.row_values(8)           
    keys[1] = keys[1].replace('.', '')
    print keys

    for rownumber in range(9, sheet.nrows):           
        # create dictionary of the row values
        values = [ cellval(c) for c in sheet.row(rownumber) ]
        data = dict(zip(keys, values))
        #print data
        scraperwiki.sqlite.save(table_name='GPpracticeLookup',unique_keys=['Practice Code'], data=data)

#Uncomment the next line if you want to regrab the data from the original spreadsheet
reGrabber()

You can find my scraper here: UK NHS GP Practices Lookup. What’s handy about this approach is that having scraped the spreadsheet data into a Scraperwiki database, I can now query it as database data via the Scraperwiki API.

(Note that the Google Visualisation API query language would also let me treat the spreadsheet data as a database if I uploaded it to Google Spreadsheets.)

So, if you find yourself with an Excel spreadsheet, but no Microsoft Office to hand, fear not… There are plenty of other tools other there you can appropriate to help you get the data out of the file and into a form you can work with:-)

PS R is capable of importing Excel files, I think, but the libraries I found don’t seem to compile onto Max OS/X?

PPS ***DATA HEALTH WARNING*** I haven’t done much testing of either of these approaches using spreadsheets containing multiple workbooks, complex linked formulae or macros. They may or may not be appropriate in such cases… but for simple spreadsheets, they’re fine…

Exploring GP Practice Level Prescribing Data

Some posts I get a little bit twitchy about writing. Accessing and Visualising Sentencing Data for Local Courts was one, and this is another: exploring practice level prescription data (get the data).

One of the reasons it feels “dangerous” is that the rationale behind the post is to demonstrate some of the mechanics of engaging with the data at a context free level, devoid of any real consideration about what the data represents, whilst using a data set that does have meaning, the interpretation of which can be used as the basis of making judgements about various geographical areas, for example.

The datasets that are the focus of this post relate to GP practice level prescription data. One datafile lists GP practices (I’ve uploaded this to Google Fusion tables), and includes practice name, identifier, and address. I geocoded the Google Fusion tables version of the data according to practice postcode, so we can see on a map how the practices are distributed:

(There are a few errors in the geocoding that could probably be fixed by editing the correspond data rows, and adding something like “, UK” to the postcode. (I’ve often thought it would be handy if you could force Google Fusion Table’s geocoder to only return points within a particular territory…))

The prescription data includes data at the level of item counts by drug name or prescription item per month for each practice. Trivially, we might do something like take the count of methadone prescriptions for each practice, and plot a map sizing points at the location of each practice by the number of methadone prescriptions by that practice. All well and good if we bear in mind the fact the the data hasn’t been normalised by the size of the practice, doesn’t take into account the area over which the patients are distributed, doesn’t take into account the demographics of the practices constituency (or recognise that a particular practice may host a special clinic, or the sample month may have included an event that drew in a large transient population with a particular condition, or whatever). A good example to illustrate this taken from another context might be “murder density” in London. It wouldn’t surprise me if somewhere like Russell Square came out as a hot spot – not because there are lots of murders there, but because a bomb went off on a single occasion killing multiple people… Another example of “crime hot spots” might well be courts or police stations, places that end up being used as default/placeholder locations if the actual location of crime isn’t known. And so on.

The analyst responsible for creating quick and dirty sketch maps will hopefully be mindful of the factors that haven’t been addressed in the construction of a sketch, and will consequently treat with suspicion any result unless they’ve satisfied themselves that various factors have been taken into account, or discount particular results that are not the current focus of the question they are asking themselves of the data in a particular way.

So when it comes to producing a post like this looking at demonstrating some practical skills, care needs to be taken not to produce charts or maps that appear to say one thing when indeed they say nothing… So bear that in mind: this post isn’t about how to generate statistically meaningful charts and tables; it’s about mechanics of getting rows of data out of big files and into a form we can start to try to make sense of them

Another reason I’m a little twitchy about this post relates to describing certain skills in an open and searchable/publicly discoverable forum. (This is one reason why folk often demonstrate core skills on “safe” datasets or randomly generated data files.) In the post Googling Nasties and Oopses on University and Public Sector Websites, a commenter asked: “is it really ethical to post that information?” in the context of an example showing how to search for confidential spreadsheet information using a web search engine. I could imagine a similar charge being leveled at a post that describes certain sorts of data wrangling skills. Maybe some areas of knowledge should be limited to the priesthood..?

To mitigate against any risks of revealing things best left undiscovered, I could draw on the NHS Information Centre’s Evaluation and impact assessment – proposal to publish practice-level prescribing data[PDF] as well as the risks acknowledged by the recent National Audit Office report on Implementing transparency (risks to privacy, of fraud, and other possible unintended consequences). But I won’t, for now…. (dangerrrrrroussssssssss…;-)

(Academically speaking, it might be interesting to go through the NHS Info Centre’s risk assessment and see just how far we can go in making those risks real using the released data set as a “white hat data hacker”, for example! I will go through the risk assessment properly in another post.)

So… let the journey into the data begin, and the reason why I felt the need to have a play with this data set:

Note: Due to the large file size (over 500MB) standard spreadsheet applications will not be able to handle the volumes of data contained in the monthly datasets. Data users will need to analyse the information using specialist data-handling software.

Hmmm… that’s not very accessible is it?!

However, if you’ve read my previous posts on Playing With Large (ish) CSV Files or Postcards from a Text Processing Excursion, or maybe even the aforementioned local sentencing data post, you may have some ideas about how to actually work with this file…

So fear not – if you fancy playing along, you should already be set up tooling wise if you’re on a Mac or a Linux computer. (If you’re on a Windows machine, I cant really help – you’ll probably need to install something like gnuwin or Cygwin – if any Windows users could add support in the comments, please do:-)

Download the data (all 500MB+ of it – it’s published unzipped/uncompressed (a zipped version comes in at a bit less than 100MB)) and launch a terminal.

>

I downloaded the December 2011 files as nhsPracticesDec2011.csv and nhsPrescribingDataDec2011.CSV so those are the filenames I’ll be using.

To look at the first few lines of each file we can use the head command:

head nhsPrescribingDataDec2011.CSV
head nhsPracticesDec2011.csv

Inspection of the practices data suggests that counties for each practice are specified, so I can generate a subset of the practices file listing just practices on the ISLE OF WIGHT by issuing a grep (search) command and sending (>) the result to a new file:

grep WIGHT nhsPracticesDec2011.CSV > wightPracDec2011.csv

The file wightPracDec2011.csv should now contain details of practices (one per row) based on the Isle of Wight. We can inspect the first few lines of the file using the head command, or use more to scroll through the data one page at a time (hit space bar to move on a page, ESCape to exit).

head wightPracDec2011.csv
more wightPracDec2011.csv

Hmmm.. there’s a rogue practice in there from the Wirral – let’s refine the grep a little:

grep 'OF WIGHT' nhsPracticesDec2011.CSV > wightPracDec2011.csv
more wightPracDec2011.csv

From looking at the data file itslef, along with the prescribing data release notes/glossary, we can see that each practice has a unique identifier. From previewing the head of the prescription data itself, as well as from the documentation, we know that the large prescription data file contains identifiers for each practice too. So based on the previous steps, can you figure out how to pull out the rows from the prescriptions file that relate to drugs issued by the Ventnor medical centre, which has code J84003? Like this, maybe?

grep J84003 nhsPrescribingDataDec2011.CSV > wightPrescDec2011_J84003.csv
head wightPrescDec2011_J84003.csv

(It may take a minute or two, so be patient…)

We can check how many rows there actually are as follows:

wc -l wightPrescDec2011_J84003.csv

I was thinking it would be nice to be able to get prescription data from all the Isle of Wight practices, so how might we go about that. From reviewing my previous text mining posts, I noticed that I could pull out data from a file by column:

cut -f 2 -d ',' wightPracDec2011.csv

This lists column two of the file wightPracDec2011.csv where columns are comma delimited.

We can send this list of codes to the grep command to pull out records from the large prescriptions file for each of the codes we grabbed using the cut command (I asked on Twitter for how to do this, and got a reply back that seemed to do the trick pretty much by return of tweet from @smelendez):

cut -d ',' -f 2 wightPracDec2011.csv | grep nhsPrescribingDataDec2011.CSV -f - > iwPrescDec2011.csv
more iwPrescDec2011.csv

We can sort the result by column – for example, in alphabetic order by column 5 (-k 5), the drugs column:

sort -t ',' -k 5 iwPrescDec2011.csv | head

Or we can sort by decreasing (-r) total ingredient cost:

sort -t ',' -k 7 -r iwPrescDec2011.csv | head

Or in decreasing order of the largest number of items:

sort -t ',' -k 6 -r iwPrescDec2011.csv | head

One problem with looking at those results is that we can’t obviously recognise the practice. (That might be a good thing, especially if we looked at item counts in increasing order… Whilst we don’t know how many patients were in receipt of one or more items of drug x if 500 or so items were prescribed in the reporting period across several practices, if there is only one item of a particular drug prescribed for one practice, then we’re down to one patient in receipt of that item across the island, which may be enough to identify them…) I leave it as an exercise for the reader to work out how you might reconcile the practice codes with practice names (Merging Datasets with Common Columns in Google Refine might be one way? Merging Two Different Datasets Containing a Common Column With R and R-Studio another..?).

Using the iwPrescDec2011.csv file, we can now search to see how many items of a particular drug are prescribed across island practices using searches of the form:

grep Aspirin iwPrescDec2011.csv
grep 'Peppermint Oil' iwPrescDec2011.csv

And this is where we now start to need taking a little care… Scanning through that data by eye, a bit of quick mental arithmetic (divide column 7 by column 6) suggests that the unit price for peppermint oil is different across practices. So is there a good reason for this? I would guess that the practices may well be describing different volumes of peppermint oil as single prescription items, which makes a quick item cost calculation largely meaningless? I guess we need to check the data glossary/documentation to confirm (or deny) this?

Okay – enough for now… maybe I’ll see how we can do a little more digging around this data in another post…

PS Just been doing a bit of doing around other GP practice level datasets – you can find a range of them on the NHS Indicator Portal. As well as administrative links up to PCT and Stategic Health Authority names, you can get data such as the size and demographic make up of each practice’s registration list, data relating to deprivation measures, models for incidence of various health conditions, practice address and phone number, the number of nursing home patients, the number of GPs per practice, the uptake of various IT initiatives(?!), patient experience data, impact on NHS services data… (Apparently a lot of this ata is available in a ‘user friendly’ format on NHS Choices website, but I couldn’t find it offhand… as part of the GP comparison service. Are there any third party sites around built on top of this data also?)

Aggregated Local Government Verticals Based on LocalGov Service IDs

(Punchy title, eh?!) If you’re a researcher interested in local government initiatives or service provision across the UK on a particular theme, such as air quality, or you’re looking to start pulling together an aggregator of local council consultation exercises, where would you start?

Really – where would you start? (Please post a comment saying how you’d make a start on this before reading the rest of this post… then we can compare notes;-)

My first thought would be to use a web search engine and search for the topic term using a site:gov.uk search limit, maybe along with intitle:council, or at least council. This would generate a list of pages on (hopefully) local gov websites relating to the topic or service I was interested in. That approach is a bit hit or miss though, so next up I’d probably go to DirectGov, or the new gov.uk site, to see if they had a single page on the corresponding resource area that linked to appropriate pages on the various local council websites. (The gov.uk site takes a different approach to the old DirectGov site, I think, trying to find a single page for a particular council given your location rather than providing a link for each council to a corresponding service page?) If I was still stuck, OpenlyLocal, the site set up several years ago by Chris Taggart/@countculture to provide a single point of reference for looking up common adminsitrivia details relating to local councils, would be the next thing that came to mind. For a data related query, I would probably have a trawl around data.gov.uk, the centralised (but far form complete) UK index of open public datasets.

How much more convenient it would be if there was a “vertical” search or resource site relating to just the topic or service you were interested in, that aggregated relevant content from across the UK’s local council websites in a single place.

(Erm… or maybe it wouldn’t?!)

Anyway, here are a few notes for how we might go about constructing just such a thing out of two key ingredients. The first ingredient is the rather wonderful Local directgov services list:

This dataset is held on the Local Directgov platform which provides the deep links into Local council websites for a number of services in Directgov. The Local Authority Service details holds the local council URLS for over 240 services where the customer can directly transfer to the appropriate service page on any council in England.

The date on the dataset post is 16/09/2011, although I’m not sure if the data file itself is more current (which is one of the issues with data.gov.uk, you could argue…). Presumably, gov.uk runs off a current version of the index? (Share…. 😉 Each item in the local directgov services list carries with it a service identifier code that describes the local government service or provision associated with the corresponding web page. That it, each URL has associated with it a piece of metadata identifying a service or provision type.

Which leads to the second ingredient: the esd standards Local Government Service List. This list maps service codes onto a short key phrase description of the corresponding service. So for example, Council – consultation and community engagement is has service identifier 366, and Pollution control – air quality is 413. (See the standards page for the actual code/vocabulary list in a variety of formats…)

As a starter for ten, I’ve pulled the Directgov local gov URL listing and local gov service list into scraperwiki (Local Gov Web Pages). Using the corresponding scraper API, we can easily run a query looking up service codes relating to pollution, for example:

select * from `serviceDesc` where ToName like '%pollution%'

From this, we can pick up what service code we need to use to look up pages related to that service (413 in the case of air pollution):

select * from `localgovpages` where LGSL=413

We can also get a link to an HTML table (or JSON representation, etc) of the data via a hackable URI:

https://api.scraperwiki.com/api/1.0/datastore/sqlite?format=htmltable&name=local_gov_web_pages&query=select%20*%20from%20%60localgovpages%60%20where%20LGSL%20%3D413

(Hackable in the sense we can easily change the service code to generate the table for the service with that code.)

So that’s the starter for 10. The next step that comes to my mind is to generate a dynamic Google custom search engine configuration file that defines a search engine that will search over just those URLs (or maybe those URLs plus the pages they link to). This would then provide the ability to generate custom search engines on the fly that searched over particular service pages from across localgov in a single, dynamically generated vertical.

A second thought is to grab those page, index them myself, crawl them/scrape them to find the pages they link to, and index those pages also (using something like tf-idf within each local council site to identify and remove common template elements from the index). (Hmmm… that could be an interesting complement to scraperwiki… SolrWiki, a site for compiling lists of links, indexing them, crawling them to depth N, and then configuring search ranking algorithms over the top of them… Hmmm… It’s a slightly different approach to generating custom search engines as a subset of a monolithic index, which is how the Google CSE and (previously) the Yahoo BOSS engines worked… Not scaleable, of course, but probably okay for small index engines and low thousands of search engines?)

Step by step: how to start in a data journalist role

Following my previous posts on the network journalist and community manager roles as part of an investigation team, this post expands on the first steps a student journalist can take in filling the data journalist role.

1: Brainstorm data that might be relevant to your investigation or field

Before you begin digging for data, it’s worth mapping out the territory you’re working in. Some key questions to ask include:

  • Who measures or monitors your field? For example:
  • Where is spending recorded? This might be at both a local and national level.
  • What are the key things that might be measured in your field? For example, in prisons they might be interested in reoffending, or overcrowding, or staffing.
  • Can you find historical data?
  • What data do you need to provide basic context? e.g.
    • Where – addresses for all institutions in your field (e.g. schools, prisons, etc.)
    • Codes – often these are used instead of institution or area names
    • Who – names of those responsible for particular aspects of your field
    • Demographics – the distribution of age, gender, ethnicity, industries, wealth, property or other elements may be important to your work
    • Politics – who is in charge in each area (local authority and local MP)
  • How could you collate data that doesn’t exist? E.g. public awareness of something; or how the policies of different bodies compare, etc.

Sometimes the simplest and quickest way to find out these things is to pick up the phone and speak to someone in a relevant organisation and ask them: what information is collected about your field, and by whom?

You can also make content from this process of research: post a guide to how your field is regulated and measured (and what information isn’t); who’s who in your field – the regulators, monitors, politicians and bodies that all have a hand in keeping it on track.

2. Learn advanced techniques to obtain that data

Once you’ve mapped it all out you can start to prioritise the datasets that are most relevant to your particular investigation. You may need to use different techniques to get hold of these, including:

Again, you can make content from this process, for example: “How we found…” or “Why we’re asking the MoJ for…” (with a link to the FOI request) or “Get the data” (here’s how to publish data online)

The flow chart below (from this previous post) helps guide you to the relevant techniques for your data:

Gathering data: a flow chart for data journalist

3. Pull out the parts of data relevant to your field/investigation

For example:

4. Add value to the data

Here are just some suggestions. You can use one or many:

Any of these provide useful opportunities for posting new content with the new contextual information (e.g. “How the data on X was gathered“) or new combined data (“Now with QOF data“) or the issues that they raise (“Why schools data may be worthless“).

5. Communicate the story in the data

I’ve written separately about the different ways of communicating data stories, so you can read that here. In short, human case studies are helpful, and visualisation is often useful.

And it’s at this point that you can also link to the further detail provided in all the content you’ve written in the previous 4 steps: How you got the data, the wider context, the specific data that’s of interest, the more detailed expert analysis or background, and so on.

Model for the 21st Century Newsroom Redux: part 1 on BBC College of Journalism blog

The BBC College of Journalism asked me to revisit my Model for the 21st Century Newsroom 4 years on. You can now read the first part of the results on their blog – with further substantial parts to follow next week. Thoughts welcome.

From Paywalls and Attention Walls to Data Disclosure Walls and Survey Walls

Is it really only a couple years since the latest, widely quoted, iteration of the idea that “If you are not paying for it, you’re not the customer; you’re the product being sold” was first posted about web economics?

[Notes for folk visiting this site from a referral thread on metafilter]

Prompted by the recent release of new Google product that presents site visotrs with a paid for, and revenue generating, survey before they can see the site’s content, here are a few observations around that idea…

First, let’s just consider the paywall for a moment. Paywalls on the web prevent you from accessing content without payment or some other form of financial subscription. I’m guessing the term was originally coined as a corruption of the term “firewall”, which in a network sense is a component that either allows or prevents network traffic from passing from one device to another based on a set of rules. For example, a firewall might blog traffic from a .xxx domain or particular IP address. [OpenLearn: What are firewalls?]

If a user can be tracked across pageviews within a single visit to a site, or across multiple visits to the site, the paywall may be configured to allow the user to see so many items for free per visit, or per month, before they are required to pay.

Paywalls, can come in a literal form – you pays your money and you gets your content – or at one step remove: you hand over your data, and it’s used to charge an advertiser a premium rate for selling ads to you as a known entity, or by selling your data to a third party. This is the sense in which you are the product. So how does it work?

If you’ve watched an online video recently, whether on a site such as Youtube, or a (commercial) watch again TV service such as ITV Player or 4od, you may way have been exposed to a pre-roll advert before the video you want to watch begins. Many commercial media websites, too, load first with an ad containing lightbox that overlays the article you actually want to read, often with a “Skip Ad” action required if you want to bail out of the ad early.

These ads are one the ways these sites generate income, of course, income that at the end of the day helps pay to keep the site running.

The price paid for these ads typically depends on the size and “quality” or specificity, as well as the size, of the audience the site delivers to the advertiser (that is, the audience segment: [OpenLearn: Market segmentation and targeting]). Sites (and magazines, and TV programmes) all have audiences with a particular demographics and set of interests, and these specialist or well defined audience groups are what the publisher sells to the advertiser.

(From years ago, I remember a bid briefing for a science outreach funding programme where we were told we would be marked down severely if we said the intended audience for our particular projects was “the general public”. What they wanted to know was what audience we were specifically going to hit, and how we were going to tune our projects to engage and inform that particular audience. Same story.)

At the end of the day, adverts are used to persuade audiences to purchase product. So you give data to a publisher, they use that to charge an advertiser a higher rate for being able to put ads in front of particular audiences who are presumably likely to to buy the advertiser’s wares if nudged appropriately, and you buy the product. With cash that pays the advertiser who bought the ad from the publisher who sold your details to them. So you still paid to access that content. With a “free gift” in the form of the goods you bought from the advertiser who bought the ads from the publisher that were placed in front of a particular audience on the basis of the data you gave to the publisher.

Let’s reconsider the paywall mediated sites, for a moment, where for example you get 10 free articles a month, 20 if you register, unlimited if you pay. The second option requires that you register some personal information with the site, such as an email address, or date of birth. You get +x article views on the site “for free” in exchange for your giving the website y pieces of data. In exchange for those free views, you have had to give something in return. You have bought those extra “free” views with your data. The money the site would have got from you if you had paid with cash is replaced by income generated from your data. For example, if the publisher sells adverts at a high price to audiences in the 17-25 range, and you are in that age range, the disclosure of your birthdate allows you to be put into that audience group which is sold to advertisers as such. If you handed over your email address, that can also be sold on to email marketers; if you had to verify that address by clicking on a link emailed to it, it becomes more valuable because it’s more likely to be a legitimate email address. More value can be added to the email address if it is sold as a verified email address belonging to a 17-25 year old, and so on.

Under the assumption that by paying attention to an ad you become more likely to buy a product, or tell someone about the product who is likely to buy it, the paywall essentially becomes replaced by an “attention based, indirect paywall”.

A new initiative by Google ramps up the data-exchange based paywall even further: Google Consumer Surveys. Marketing magazine describes it as follows (Google’s new survey tool: DIY research tool and pay wall alternative):

‘Google Consumer Surveys’ is a survey tool which blocks sections of webpages or articles until the reader answers a question, paying the website owner five cents per response when they do. The service is being billed as an alternative revenue model for publishers considering a pay wall strategy, launching with a handful of news partners last week.

The service works as a DIY research tool, charging users 10 cents per response to questions of the their choice. Buyers of the research have the option to pay an extra 40 cents per response to target sub-populations based on gender, age and location and can target more specific audiences, such as dog owners, with a screening and follow-up question option that costs an additional 50 cents per response.

So let’s unpick that: rather than running ads, the publisher runs a survey. They essentially get paid (via Google) for running the survey by someone who pays Google to run the survey. You hand over your data to the survey company who pays Google who pays the publisher for delivering you, the survey subject. Rather than targeting ads at you, Google targets you as a survey subject, mediated by the publisher who delivers a particular audience demographic; (rather than using sites to target particular audiences, I guess Google will end up using knowledge about audiences to ensure that surveys are displayed to a wide range of subjects, thus ensuring a fair sample. Which means, as Marketing mag suggests, “the questions [will] potentially having nothing to do with the site’s content…”). Rather trying to influence you as a purchaser by presenting you with an ad, in the hope that you will return cash to the person who orginally paid for the ad by buying their wares, disclosure about your beliefs is now the currency. (I need to check about the extent to which: a) Google can in principle and in fact reconcile survey results with a user ID; b) the extent to which Google provides detailed information back to the survey commissioner about the demographics and identity of the survey subjects. Marketing mag suggests “[t]o pre-empt any privacy fears, the search giant is emphasising that all surveys will be completely anonymous and that Google will not use any data collected for its own ad targeting.” So that’s all right then. But Google will presumably know that it has served you x ads and y surveys, if not what answers you gave to survey qustions.).

As well as productising yourself, as sold by publishers to advertisers, by virtue of handing over your data, you’ve also paid in a couple of other senses too – with your attention and with your time. Your attention and your demographic details (that is, your propensity to buy and, at the end of the day, your purchasing power (i.e. your cash) are what you exchange for the “free” content; if your time represents your ability to use that time generating your own income, there may also be an opportunity cost to you (that is, you have not generated 1 hour’s income doing paid for work because you have spent 1 hour watching ads). The cost to you is a loss of income you may otherwise have earned by using that time for paid work.

A couple of the missing links in advertising, of course, are reliable feedback about: 1) whether anyone actually pays attention to your ad; 2) whether they act on it. Google cracked part of action puzzle, at least in terms of ad payments, by coming up with an advertising charging model that got advertisers to bid for ad placements and then only pay if someone clicked through on the ad (Pay-per-click, PPC advertsing) rather than using the original display oriented, “impression based” advertising, where advertisers would pay for so many impressions of their advert (CPM, cost per mille (i.e. cost per thousand impressions).

It seems that Google are now trying to put CPM based metrics on a firmer footing with a newly announced metric, Active View (Making the Web Work for Brand Marketers).

Advertisers have long looked for insight into whether consumers saw an ad on page 145 of a magazine, or switched the channel during a TV commercial break. It’s similar online, so we’re rolling out a technology [Active View], … that can count “viewed” impressions (as defined by the IAB’s proposed standard, this is a display ad that is at least 50% viewable on the screen for at least one second).

… Active View data will be immediately actionable — advertisers will be able to pay only for for viewed impressions.

They’re also looking to improve feedback on the demographics of users who actually view an advert:

Active GRP: GRP, or a gross rating point, is at the heart of offline media measurement. For example, when a fashion brand wants their TV campaign to reach 2 million women with two ads each, they use GRP to measure that. We’re introducing a new version of this for the web: Active GRP. …

… Active GRP is calculated by a statistical model that combines aggregated panel data and anonymous user data (either inferred or user-provided), and will work in conjunction with Active View to measure viewed impressions. This approach overcomes problems of potential panel skewing and reliance on a single data source. This approach also has the advantage of never using personally identifiable information, not sharing user data with third parties, and enabling users, through Google’s Ads Preferences Manager, to opt-out.

Both these announcements were made in the context of Google’s Brand Activate initiative.

Facebook, too, is looking to improve it’s reporting – and maybe its ad targeting? – to advertisers. Although I can’t offhand find an original Facebook source, TechCrunch (Facebook Ads Can Now Be Optimized To Drive Any On-Facebook Action, Such As In-App Purchases, Shares, Offer Claims), Mashable (Facebook’s Analytics Tool for Ads Will Soon Measure Actions Other Than ‘Likes’) et al are reporting on a Facebook briefing that described how advertisers will be able to view reports describing the downstream actions taken by people who have viewed a particular advert. The Facebook article also suggests that the likelihood of a user performing a particular action might form part of the targeting criteria (“today Facebook begins allowing advertisers using its API to ask it to show their ads to people most likely to take any specific post-click action on the social network, such as sharing a brand’s content to the news feed, buying virtual goods in their apps, or redeeming one of the new Facebook Offers at a local brick-and-mortar store”).

So now, it seems that the you that is the product may well soon include your (likely) actions…

See also: Expectations Matter, Even If You’re Not ‘A Customer’ which links in to a discussion about what reasonable expectations you might have as a user of a “free” service.

And this: Contextual Content Delivery on Higher Ed Websites Using Ad Servers, on something of Google’s ad targeting capacity as of a couple of years ago…

[Notes: I would reply in the thread but I don’t want to have to pay cash for the, erm, privilege of doing so… I also appreciate that none of these ideas are necessarily original, and I recognise that the model applies to TV, radio, print or whatever other content carrier and container you care to talk about… I suspect that Blue Beetle isn’t actually the source of the “you are the product” slogan this time round, anyway, (in recent months, Wired probably is) although many search engines lead that way. (So for example, it’s easy to find earlier, similarly pithy, expressions of the same sentiment in the web context all over the place… For example, this 2009 post; or this one). And not that you’ll care, this blog is my notebook, and these notes are just me scribbling down some context around the Google survey product (the post construction/writing style reflects that) #trollFeeding PS Since everybody knows that 1+1=2, I figure we probably don’t need to teach it anymore #deadHorseFlogging #gettingChildishNow #justLikeAMetaFilterThread]

When data goes bad

Incorrect-statistics

Image by Lauren York

Data is so central to the decision-making that shapes our countries, jobs and even personal lives that an increasing amount of data journalism involves scrutinising the problems with the very data itself. Here’s an illustrative list of when bad data becomes the story – and the lessons they can teach data journalists:

Deaths in police custody unrecorded

This investigation by the Bureau of Investigative Journalism demonstrates an important question to ask about data: who decides what gets recorded?

In this case, the BIJ identified “a number of cases not included in the official tally of 16 ‘restraint-related’ deaths in the decade to 2009 … Some cases were not included because the person has not been officially arrested or detained.”

As they explain:

“It turns out the IPCC has a very tight definition of ‘in custody’ –  defined only as when someone has been formally arrested or detained under the mental health act. This does not include people who have died after being in contact with the police.

“There are in fact two lists. The one which includes the widely quoted list of sixteen deaths in custody only records the cases where the person has been arrested or detained under the mental health act. So, an individual who comes into contact with the police – is never arrested or detained – but nonetheless dies after being restrained, is not included in the figures.

“… But even using the IPCC’s tightly drawn definition, the Bureau has identified cases that are still missing.”

Cross-checking the official statistics against wider reports was key technique. As was using the Freedom of Information Act to request the details behind them and the details of those “ who died in circumstances where restraint was used but was not necessarily a direct cause of death”.

Cooking the books on drug-related murders

Drug related murders in Mexico
Cross-checking statistics against reports was also used in this investigation by Diego Valle-Jones into Mexican drug deaths:

“The Acteal massacre committed by paramilitary units with government backing against 45 Tzotzil Indians is missing from the vital statistics database. According to the INEGI there were only 2 deaths during December 1997 in the municipality of Chenalho, where the massacre occurred. What a silly way to avoid recording homicides! Now it is just a question of which data is less corrupt.”

Diego also used the Benford’s Law technique to identify potentially fraudulent data, which was also used to highlight relationships between dodgy company data and real world events such as the dotcom bubble and deregulation.

Poor records mean no checks

Detective Inspector Philip Shakesheff exposed a “gap between [local authority] records and police data”, reported The Sunday Times in a story headlined ‘Care home loses child 130 times‘:

“The true scale of the problem was revealed after a check of records on police computers. For every child officially recorded by local authorities as missing in 2010, another seven were unaccounted for without their absence being noted.”

Why is it important?

“The number who go missing is one of the indicators on which Ofsted judges how well children’s homes are performing and the homes have a legal duty to keep accurate records.

“However, there is evidence some homes are failing to do so. In one case, Ofsted gave a good report to a private children’s home in Worcestershire when police records showed 1,630 missing person reports in five years. Police stationed an officer at the home and pressed Ofsted to look closer. The home was downgraded to inadequate and it later closed.

“The risks of being missing from care are demonstrated by Zoe Thomsett, 17, who was Westminster council’s responsibility. It sent her to a care home in Herefordshire, where she went missing several times, the final time for three days. She had earlier been found at an address in Hereford, but because no record was kept, nobody checked the address. She died there of a drugs overdose.

“The troubled life of Dane Edgar, 14, ended with a drugs overdose at a friend’s house after he repeatedly went missing from a children’s home in Northumberland. Another 14-year-old, James Jordan, was killed when he absconded from care and was the passenger in a stolen car.”

Interests not registered

When there are no formal checks on declarations of interest, how can we rely on it? In Chile, the Ciudadano Inteligente Fundaciondecided to check the Chilean MPs’ register of assets and interests by building a database:

“No-one was analysing this data, so it was incomplete,” explained Felipe Heusser, executive president of the Fundacion. “We used technology to build a database, using a wide range of open data and mapped all the MPs’ interests. From that, we found that nearly 40% of MPs were not disclosing their assets fully.”

The organisation has now launched a database that “enables members of the public to find potential conflicts of interest by analysing the data disclosed through the members’ register of assets.”

Data laundering

Tony Hirst’s post about how dodgy data was “laundered” by Facebook in a consultants report is a good illustration of the need to ‘follow the data’.

We have some dodgy evidence, about which we’re biased, so we give it to an “independent” consultant who re-reports it, albeit with caveats, that we can then report, minus the caveats. Lovely, clean evidence. Our lobbyists can then go to a lazy policy researcher and take this scrubbed evidence, referencing it as finding in the Deloitte report, so that it can make its way into a policy briefing.”

“Things just don’t add up”

In the video below Ellen Miller of the Sunlight Foundation takes the US government to task over the inconsistencies in its transparency agenda, and the flawed data published on its USAspending.gov – so flawed that they launched the Clearspending website to automate and highlight the discrepancy between two sources of the same data:

Key budget decisions made on useless data

Sometimes data might appear to tell an astonishing story, but this turns out to be a mistake – and that mistake itself leads you to something much more newsworthy, as Channel 4′s FactCheck foundwhen it started trying to find out if councils had been cutting spending on Sure Start children’s centres:

“That ought to be fairly straightforward, as all councils by law have to fill in something called a Section 251 workbook detailing how much they are spending on various services for young people.

“… Brent Council in north London appeared to have slashed its funding by nearly 90 per cent, something that seemed strange, as we hadn’t heard an outcry from local parents.

“The council swiftly admitted making an accounting error – to the tune of a staggering £6m.”

And they weren’t the only ones. In fact, the Department for Education  admitted the numbers were “not very accurate”:

“So to recap, these spending figures don’t actually reflect the real amount of money spent; figures from different councils are not comparable with each other; spending in one year can’t be compared usefully with other years; and the government doesn’t propose to audit the figures or correct them when they’re wrong.”

This was particularly important because the S251 form “is the document the government uses to reallocate funding from council-run schools to its flagship academies.”:

“The Local Government Association (LGA) says less than £250m should be swiped from council budgets and given to academies, while the government wants to cut more than £1bn, prompting accusations that it is overfunding its favoured schools to the detriment of thousands of other children.

“Many councils’ complaints, made plain in responses to an ongoing government consultation, hinge on DfE’s use of S251, a document it has variously described as “unaudited”, “flawed” and”not fit for purpose”.

No data is still a story

Sticking with education, the TES reports on the outcome of an FOI request on the experience of Ofsted inspectors:

“[Stephen] Ball submitted a Freedom of Information request, asking how many HMIs had experience of being a secondary head, and how many of those had led an outstanding school. The answer? Ofsted “does not hold the details”.

““Secondary heads and academy principals need to be reassured that their work is judged by people who understand its complexity,” Mr Ball said. “Training as a good head of department or a primary school leader on the framework is no longer adequate. Secondary heads don’t fear judgement, but they expect to be judged by people who have experience as well as a theoretical training. After all, a working knowledge of the highway code doesn’t qualify you to become a driving examiner.”

“… Sir Michael Wilshaw, Ofsted’s new chief inspector, has already argued publicly that raw data are a key factor in assessing a school’s performance. By not providing the facts to back up its boasts about the expertise of its inspectors, many heads will remain sceptical of the watchdog’s claims.”

Men aren’t as tall as they say they are

To round off, here’s a quirky piece of data journalism by dating site OkCupid, which looked at the height of its members and found an interesting pattern:

Male height distribution on OKCupid

“The male heights on OkCupid very nearly follow the expected normal distribution—except the whole thing is shifted to the right of where it should be.

“Almost universally guys like to add a couple inches. You can also see a more subtle vanity at work: starting at roughly 5′ 8″, the top of the dotted curve tilts even further rightward. This means that guys as they get closer to six feet round up a bit more than usual, stretching for that coveted psychological benchmark.”

Do you know of any other examples of bad data forming the basis of a story? Please post a comment – I’m collecting examples.

UPDATE (April 20 2012): A useful addition from Simon Rogers: Named and shamed: the worst government annual reports explains why government department spending reports fail to support the Government’s claimed desire for an “army of armchair auditors”, with a list of the worst offenders at the end.

Also: