Category Archives: data journalism

Time for UK media organisations to use some lobbying muscle

There are two Cabinet Office consultations taking place at the moment around open data: one around data policy for the new Public Data Corporation (PDC), and another around the government’s policy around transparency and open data strategy.

This should be of enormous interest to any media organisation – a key opportunity to influence the availability of information of public interest.

For example, among the issues under consideration are (summed up by Tony Hirst): charging for PDC information, licensing and regulation.

These will all be vital elements in the future of journalism – news organisations and journalists should be vocal in shaping them.

The deadline for both consultations is October 27.

SFTW: How to scrape webpages and ask questions with Google Docs and =importXML

XML puzzle cube

Image by dullhunk on Flickr

Here’s another Something for the Weekend post. Last week I wrote a post on how to use the =importFeed formula in Google Docs spreadsheets to pull an RSS feed (or part of one) into a spreadsheet, and split it into columns. Another formula which performs a similar function more powerfully is =importXML.

There are at least 2 distinct journalistic uses for =importXML:

  1. You have found information that is only available in XML format and need to put it into a standard spreadsheet to interrogate it or combine it with other data.
  2. You want to extract some information from a webpage – perhaps on a regular basis – and put that in a structured format (a spreadsheet) so you can more easily ask questions of it.

The first task is the easiest, so I’ll explain how to do that in this post. I’ll use a separate post to explain the latter. Continue reading

SFTW: How to grab useful political data with the They Work For You API

They Work For You

It’s been over 2 years since I stopped doing the ‘Something for the Weekend’ series. I thought I would revive it with a tutorial on They Work For You and Google Refine…

If you want to add political context to a spreadsheet – say you need to know what political parties a list of constituencies voted for, or the MPs for those constituencies – the They Work For You API can save you hours of fiddling – if you know how to use it.

An API is – for the purposes of journalists – a way of asking questions for reams of data. For example, you can use an API to ask “What constituency is each of these postcodes in?” or “When did these politicians enter office?” or even “Can you show me an image of these people?”

The They Work For You API will give answers to a range of UK political questions on subjects including Lords, MLAs (Members of the Legislative Assembly in Northern Ireland), MPs, MSPs (Members of the Scottish Parliament), select committees, debates, written answers, statements and constituencies.

When you combine that API with Google Refine you can fill a whole spreadsheet with additional political data, allowing you to answer questions you might otherwise not be able to.

I’ve written before on how to use Google Refine to pull data into a spreadsheet from the Google Maps API and the UK Postcodes API, but this post takes things a bit further because the They Work For You API requires something called a ‘key’. This is quite common with APIs so knowing how to use them is – well – key. If you need extra help, try those tutorials first. Continue reading

How to collaborate (or crowdsource) by combining Delicious and Google Docs

RSS girl by Heather Weaver

RSS girl by HeatherWeaver on Flickr

During some training in open data I was doing recently, I ended up explaining (it’s a long story) how to pull a feed from Delicious into a Google Docs spreadsheet. I promised I would put it down online, so: here it is.

In a Google Docs spreadsheet the formula =importfeed will pull information from an RSS feed and put it into that spreadsheet. Titles, links, datestamps and other parts of the feed will each be separated into their own columns.

When combined with Delicious, this can be a useful way to collect together pages that have been bookmarked by a group of people, or any other feed that you want to analyse.

Here’s how you do it: Continue reading

When information is power, these are the questions we should be asking

Various commentators over the past year have made the observation that “Data is the new oil“. If that’s the case, journalists should be following the money. But they’re not.

Instead it’s falling to the likes of Tony Hirst (an Open University academic), Dan Herbert (an Oxford Brookes academic) and Chris Taggart (a developer who used to be a magazine publisher) to fill the scrutiny gap. Recently all three have shone a light into the move towards transparency and open data which anyone with an interest in information would be advised to read.

Hirst wrote a particularly detailed post breaking down the results of a consultation about higher education data.

Herbert wrote about the publication of the first Whole of Government Accounts for the UK.

And Taggart made one of the best presentations I’ve seen on the relationship between information and democracy.

What all three highlight is how control of information still represents the exercise of power, and how shifts in that control as a result of the transparency/open data/linked data agenda are open to abuse, gaming, or spin. Continue reading

In Spanish: The inverted pyramid of data journalism part 2

Mauro Accurso has followed up his rapid translation of last week’s inverted pyramid of data journalism with a Spanish version of part 2: the 6 C’s of communicating data journalism. It’s copied in full below.

La semana pasada les traduje la primera parte de La Pirámide Invertida del Periodismo de Datos de Paul Bradshaw que prometió extender en el aspecto de comunicación del extenso proceso que significa el periodismo de datos.

comunicar periodismo de datosEn esta segunda parte Paul recorre 6 formas diferentes de comunicar en periodismo de datos que pueden ver en el cuadro de arriba y al final encontrarán un gráfico que resume toda la teoría (la cual está en desarrollo todavía y Bradshaw pide aportes, comentarios y sugerencias):

Continue reading

6 ways of communicating data journalism (The inverted pyramid of data journalism part 2)

UPDATE: A new version of the inverted pyramid, with new stages and resources for each, is now available.

Last week I published an inverted pyramid of data journalism which attempted to map processes from initial compilation of data through cleaning, contextualising, and combining that. The final stage – communication – needed a post of its own, so here it is.

UPDATE: Now in Spanish too.

Below is a diagram illustrating 6 different types of communication in data journalism. (I may have overlooked others, so please let me know if that’s the case.)

Communicate: visualised, narrate, socialise, humanise, personalise, utilise

Modern data journalism has grown up alongside an enormous growth in visualisation, and this can sometimes lead us to overlook different ways of telling stories involving big numbers. The intention of the following is to act as a primer for ensuring all options are considered.
Continue reading

The inverted pyramid of data journalism – in Spanish

Barely 7 hours after I published yesterday’s ‘Inverted pyramid of data journalism‘, it had been translated into Spanish – by the wonderful Mauro Accurso. The post is copied in full below.

Ya hace un tiempo traduje todo el Modelo para la redacción del siglo XXI cuya parte principal es el Diamante de noticias en contraposición a la clásica pirámide invertida que enseñan en cualquier facultad de periodismo (luego vimos el ciclo de vida de las noticias digitales: el diamante de noticias reimaginado y otra vez eldiamante de noticias reinterpretado).

Pero ahora una vez más Paul Bradshaw nos trae un diagrama interesante para, en este caso, explicar el proceso de creación del periodismo de datos. Esta pirámide invertida del periodismo de datos muestra de forma simple como se avanza desde una gran cantidad de información que incrementalmente se va enfocando hasta llegar al punto de comunicar los resultados a la audiencia de la forma más clara posible. A continuación, la traducción del artículo donde podemos ver lasdiferentes etapas del proceso de data journalism: Continue reading

Cleaning data using Google Refine: a quick guide

I’ve been focusing so much on blogging the bells and whistles stuff that Google Refine does that I’ve never actually written about its most simple function: cleaning data. So, here’s what it does and how to do it:

  1. Download and install Google Refine if you haven’t already done so. It’s free.
  2. Run it – it uses your default browser.
  3. In the ‘Create a new project’ window click on ‘Choose file‘ and find a spreadsheet you’re working with. If you need a sample dataset with typical ‘dirty data’ problems I’ve created one you can download here.
  4. Give it a project name and click ‘Create project‘. The spreadsheet should now open in Google Refine in the browser.
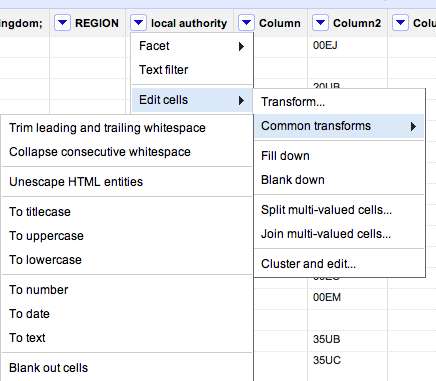
  5. At the top of each column you’ll see a downward-pointing triangle/arrow. Click on this and a drop-down menu opens with options including Facet; Text filter; Edit cells; and so on.
  6. Click on Edit cells and a further menu appears.
  7. The second option on this menu is Common transforms. Click on this and a final menu appears (see image below).

You’ll see there are a range of useful functions here to clean up your data and make sure it is consistent. Here’s why:

Trim leading and trailing whitespace

Sometimes in the process of entering data, people put a space before or after a name. You won’t be able to see it, but when it comes to counting how many times something is mentioned, or combining two sets of data, you will hit problems, because as far as a computer or spreadsheet is concerned, ” Jones” is different to “Jones”.

Clicking this option will remove those white spaces.

Collapse consecutive whitespace

Likewise, sometimes a double space will be used instead of a single space – accidentally or through habit, leading to more inconsistent data. This command solves that problem.

Unescape HTML entities

At some point in the process of being collected or published, HTML may be added to data. Typically this represents punctuation of some sort. “"” for example, is the HTML code for quotation marks. (List of this and others here).

This command will convert that cumbersome code into the characters they actually represent.

To titlecase/To uppercase/To lowercase

Another common problem with data is inconsistent formatting – occasionally someone will LEAVE THE CAPS LOCK ON or forget to capitalise a name.

This converts all cells in that column to be consistently formatted, one way or another.

To number/To date/To text

Like the almost-invisible spaces in data entry, sometimes a piece of data can look to you like a number, but actually be formatted as text. And like the invisible spaces, this becomes problematic when you are trying to combine, match up, or make calculations on different datasets.

This command solves that by ensuring that all entries in a particular column are formatted the same way.

Now, I’ve not used that command much and would be a bit careful – especially with dates, where UK and US formatting is different, for example. If  you’ve had experiences or tips on those lines let me know.

Other transforms

In addition to the commands listed above under ‘common transforms’ there are others on the ‘Edit cells’ menu that are also useful for cleaning data:

Split / Join multi-valued cells…

These are useful for getting names and addresses into a format consistent with other data – for example if you want to split an address into street name, city, postcode; or join a surname and forename into a full name.

Cluster and edit…

A particularly powerful cleaning function in Google Refine, this looks at your column data and suggests ‘clusters’ where entries are similar. You can then ask it to change those similar entries so that they have the same value.

There is more than one algorithm (shown in 2 drop-down menus: Method and Keying function) used to cluster – try each one in turn, as some pick up clusters that others miss.

If you have any other tips on cleaning data with Google Refine, please add them.