Tag Archives: metrics

Snapchat for journalists (part 4): sharing and measuring your story

In the previous parts of this series I covered different types of stories, tools, and thinking about narrative. In this extract from the ebook Snapchat for Journalists I cover the practicalities of storing, sharing and measuring your Snapchat stories.

Snapchat book cover

You can read more in the ebook (also available in the Kindle Store)

Sharing your Snapchat Story

Each snap in a story only lasts for 24 hours, so it’s worth making sure you share them as early as possible, and regularly before they have finished.

You cannot share a link to your Snapchat story: people need to be following you on Snapchat and checking it for notifications. Whenever you add a new snap to your story, they will receive a subtle notification within Snapchat.

To share it you have a number of options: Continue reading

Metrics and the media: we can measure it – but can we manage it?

Today I will be chairing the ‘Data Strategy’ track of talks at the Monetising Media conference: individuals in every part of the industry talking about how metrics now inform not just content strategy but revenue, advertising, and customer relations.

As I introduce the day I will be thinking about two pieces of data in particular: research by the Tow Center’s Caitlin Petre into the use of Chartbeat; and Checking, Sharing, Clicking and Linking, a piece of research into consumption. Continue reading

Tips on choosing the right Twitter hashtag: a tale of 5 hashtags

brumvote related tags

What do you do when you’ve been using a hashtag for some time and another one comes along with the potential to be more popular? Do you jump on board – or do you stick with the hashtag you’ve built up? How do you measure the best hashtag to use for your work?

That’s the question that a team of my undergraduate journalism students at Birmingham City University faced last month. And here’s how they addressed it. 

First, some background: in February this year the students launched their election coverage under the hashtag #brumvote.

The hashtag worked well – it took in everything from BuzzFeed-style listicles to hustings liveblogs and data-driven analysis of local MPs’ expenses and voting patterns.

Then last month a similar hashtag appeared: the BBC launched their own youth-targeting election project, with the hashtag #brumvotes.

At this point the students faced 3 choices:

  1. Keep using the #brumvote hashtag
  2. Adopt the new #brumvotes hashtag
  3. Use both

Changing hashtag would involve changing dozens of posts from previous coverage, but would the clout of the BBC mean missing out on a potentially more successful hashtag? Continue reading

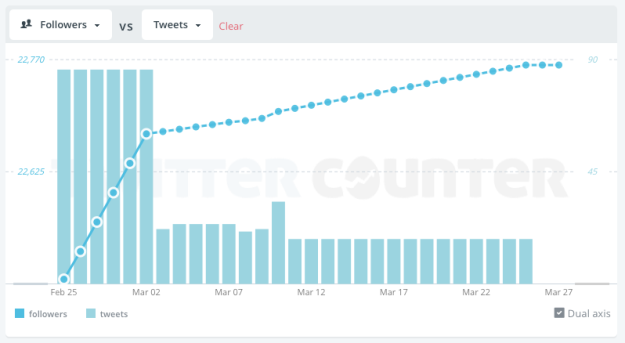
11 charts that illustrate how you can use Twittercounter to check your impact on social media as a journalist

twittercounter

Last year I decided to require my students to submit analytics as part of all their online journalism work. One of the tools that I recommended was Twittercounter.

The free version of Twittercounter does something very simple: it shows you a chart comparing two of three metrics: your followers, your volume of tweets, or the number of people you are following.

It’s not completely accurate, but its simplicity does something very important: it focuses your attention on whether your use of social media has any impact, on one metric at least: the size of your audience.

Of course followers is only one metric – I’ll write in a future post about other metrics and other ways of measuring those – but the ease with which Twittercounter works makes it as good a place as any for aspiring students to begin exploring the importance of measurement in modern journalism.

By way of example, here are 11 charts which show how a simple tool like Twittercounter can illustrate what you’re going right as a journalist – and where you can improve. Continue reading

16 reasons why this research will change how you look at news consumption

Most research on news consumption annoys me. Most research on news consumption – like Pew’s State of the News Mediarelies on surveys of people self-reporting how they consume news. But surveys can only answer the questions that they ask. And as any journalist with a decent bullshit detector should know: the problem is people misremember, people forget, and people lie.

The most interesting news consumption research uses ethnography: this involves watching people and measuring what they actually do – not what they say they do. To this end AP’s 2008 report A New Model for News is still one of the most insightful pieces of research into news consumption you’ll ever read – because it picks out details like the role that email and desktop widgets play, or the reasons why people check the news in the first place (they’re bored at work, for example).

Now six years on two Dutch researchers have published a paper summarising various pieces of ethnographic and interview-based consumption research (£) over the last decade – providing some genuine insights into just how varied news ‘consumption’ actually is.

Irene Costera Meijer and Tim Groot Kormelink‘s focus is not on what medium people use, or when they use it, but rather on how engaged people are with the news.

To do this they have identified 16 different news consumption practices which they give the following very specific names:

  1. Reading
  2. Watching
  3. Viewing
  4. Listening
  5. Checking
  6. Snacking
  7. Scanning
  8. Monitoring
  9. Searching
  10. Clicking
  11. Linking
  12. Sharing
  13. Liking
  14. Recommending
  15. Commenting
  16. Voting

Below is my attempt to summarise those activities, why they’re important for journalists and publishers, and the key issues they raise for the way that we publish. Continue reading

Study: do news industry metrics underplay print’s importance? (cross post)

In a cross-post for OJB originally published on The Conversation, Neil Thurman argues that his recent research that suggests current news industry metrics underplay the importance of print reading time. 

Figures published recently suggest that more than 90% of newspaper reading still happens in print. This might come as a surprise given the gloomy assessments often made of the state of print media in the UK but, it turns out, we’re just not measuring success properly. Continue reading

20 free ebooks on journalism (for your Xmas Kindle) {updated to 65}

Journalism 2.0 cover

As many readers of this blog will have received a Kindle for Christmas I thought I should share my list of the free ebooks that I recommend stocking up on.

Online journalism and multimedia ebooks

Starting with more general books, Mark Briggs‘s book Journalism 2.0 (PDF*) is a few years old but still provides a good overview of online journalism to have by your side. Mindy McAdams‘s 42-page Reporter’s Guide to Multimedia Proficiency (PDF) adds some more on that front, and Adam Westbrook‘s Ideas on Digital Storytelling and Publishing (PDF) provides a larger focus on narrative, editing and other elements.

After the first version of this post, MA Online Journalism student Franzi Baehrle suggested this free book on DSLR Cinematography, as well as Adam Westbrook on multimedia production (PDF). And Guy Degen recommends the free ebook on news and documentary filmmaking from ImageJunkies.com.

The Participatory Documentary Cookbook [PDF] is another free resource on using social media in documentaries.

A free ebook on blogging can be downloaded from Guardian Students when you register with the site, and Swedish Radio have produced this guide to Social Media for Journalists (in English).

The Traffic Factories is an ebook that explores how a number of prominent US news organisations use metrics, and Chartbeat’s role in that. You can download it in mobi, PDF or epub format here.

Continue reading

How do you measure a blog’s success?

Brazil correspondent Gabriela Zago looks at the variety of metrics for evaluating the popularity of blogs. A Portuguese language version of this is available here.

There are many ways to measure a website’s success. Some use a more quantitative approach, and others are more qualitatively based. You can say a weblog is popular for many reasons, such as:

  • traffic (page views, visits, visitors),
  • discussions (comments, trackbacks, linkbacks),
  • position in search engines (page rank),
  • readership (feed subscriptions, blogroll presence) and
  • reputation (a more subjective approach, based on what people think of a website, and the qualifications of the person that writes for it).

If you obtain all that data and construct rankings based on these different types of information, chances are that not all blogs ranked will appear in the exact same position in each one of the ranks. Continue reading