Category Archives: data journalism

Brazilian journalists launch network analysis tool to investigate political relationships

Cruza Grafos

The Brazilian Association of Investigative Journalism (Abraji) has launched an advanced data tool to help journalists research about politicians and companies, reports Beatriz Farrugia

The platform, Cruza Grafos (“Crossing Graphs”), was created by a partnership between Brasil.io and the Google News Initiative

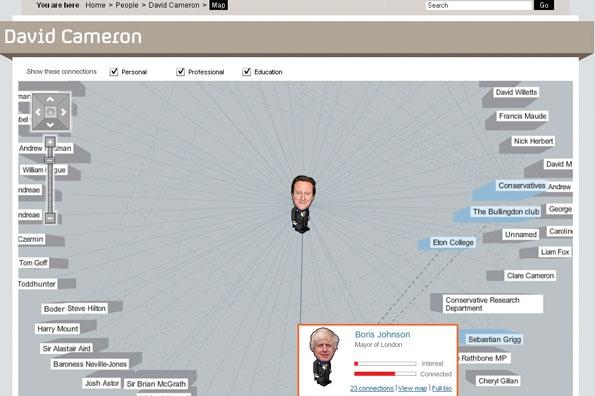
Cruza Grafos (registration required) is an online visual interface where journalists can research political candidates, and relate candidates to companies and entities with an official registration number in Brazil. 

The tool allows journalists to work with huge datasets without any coding.

According to Reinaldo Chaves, Abraji’s project coordinator, many journalists do not know how to code or even how to open a spreadsheet — a situation that makes some investigative projects impossible to happen. 

“We hope the Cruza Grafos makes this kind of investigation easier and democratizes access to huge datasets.”

Continue reading

3 more angles most often used to tell data stories: explorers, relationships and bad data stories

Scale: 'This is how big an issue is' Change/stasis: ‘This is going up/down/not improving’ Outliers/ranking: ‘The best/worst/where we rank’ Variation: "Postcode lotteries" and distributions Exploration: Tools, simulators, analysis — and art Relationships/debunking: ‘Things are connected’ — or not, networks and flows of power and money Problems & solutions: ‘Concerns over data’, ‘Missing data’, ‘Get the data’

Previously I wrote about four of the 7 angles that are used to tell stories about data. In this second part I look at the three further angles: those stories focusing on relationships; ‘meta data’ angles that focus on data’s absence, poor quality, or collection — and exploratory features that mix multiple angles or provide an opportunity to get to the grips with the data itself.

Data angle 5. ‘Explore’: tools, interactivity — and art

How Y’all, Youse and You Guys Talk
This New York Times interactive became one of their most-read stories of all time

There are two broad categories of exploratory story:

  1. Interactive stories characterised by an explicit ‘call to action’  like “explore”, “play” or “Take the quiz” — or a more implicit invitation to users to explore what has been “Mapped” or “Every X that ever happened”; and
  2. Exploratory features that raise (and then answer) a question. These features often combine more than one of the first three angles (scale, change, ranking) or apply the angle to more than one measure or category. The key quality is that the core angle of the feature is ‘we explore’ multiple aspects rather than ‘we reveal the scale/rank/change’ of one main thing.
Continue reading

Here are the angles journalists use most often to tell the stories in data

7 common angles for data storie: scale, change, ranking, variation, explore, relationships, bad data, leads

In my data journalism teaching and training I often talk about common types of stories that can be found in datasets — so I thought I would take 100 pieces of data journalism and analyse them to see if it was possible to identify how often each of those story angles is used.

I found that there are actually broadly seven core data story angles. Many incorporate other angles as secondary dimensions in the storytelling (a change story might go on to talk about the scale of something, for example), but all the data journalism stories I looked at took one of these as its lead.

In the first of a two-part series (also in Norwegian, Uzbek, Portuguese and Finnish.) I walk through how the four most common angles can help you identify story ideas, the variety of their execution, and the considerations to bear in mind.

Continue reading

A journalist’s introduction to network analysis

David Cameron's network

Channel 4’s Who Knows Who project was an early adopter of network analysis

Network analysis offers enormous potential for journalism: able to tease out controversial connections and curious clusters, and to make visible that which we could not otherwise see, it’s also often about relationships and power.

It is both a data journalism technique and an open source intelligence (OSINT) technique — and yet it is relatively underused in both, most likely because the tools to do network analysis have only become accessible in the last few years.

Here, then, is an introduction for journalists, adapted from my lectures on the MA in Data Journalism at Birmingham City University.

How network analysis is used in journalism

Network analysis is, simply, a way of making relationships between entities visible.

It might be used in journalism to generate or check leads (by showing unusual patterns), to communicate the story itself (i.e. to show those patterns to others) or to allow readers to explore a system. Continue reading

Coronavirus: 3 ways journalists need to get to grips with uncertainty during the pandemic

R number ranges in different UK regions

R number ranges shown by the FT

Journalism doesn’t like uncertainty: editors are trained to cut out vagueness and journalists taught to be as concrete as possible in their reporting. In most cases it compels reporters to ensure they have a firm grip on the details and are confident in the story they are reporting.

But with coronavirus, this discipline becomes a systemic blind spot.

From prevalence to testing, and from deaths to infection rates, the story of this pandemic is full of uncertainty. Here, then, are 3 ways that journalists need to understand — and better communicate — the things that we don’t know, and won’t know, about it. Continue reading

How to brainstorm COVID-19 data story ideas

Reporting beyond the case numbers: How to brainstorm COVID-19 data story ideas

I’ve written a piece for DataJournalism.com on covering the societal impact of a pandemic with data — it covers:

  • Stories to report in the short term
  • Moving beyond health stories
  • Looking for stories about changing behaviour
  • Thinking creatively about data
  • Stories from historical data
  • Interactivity as a data angle
  • Looking and planning ahead

It’s not all about numbers: 6 ways that data can give you a story lead

Changing figures: 'New data says X' Data leads to an interview feature or profile Data leads to reaction/action story Explainers, infographics + 'in numbers': topical context Explorers: interactives, 'mapped', 'you draw it' A story about the lack of data, or concerns over quality

It’s a common misconception of data journalism that the resulting stories will be all about numbers. In fact, the data is often just a stepping stone — it might take you to interviews, or help you find case studies; it might give you the spark for a feature idea without a single number.

Recently I was asked about these alternatives to ‘number stories’ by one of my part time PGCert Data Journalism students — so here are the 6 tips I shared with them:
Continue reading

How to: plan a journalism project that needs data entry

Panorama source: FOI sent to 144 councils

This Panorama investigation involved entering data from 144 FOI responses

Data-driven reporting regularly involves some form of data entry — some of the stories I’ve been involved with, for example, have included entering information from Freedom of Information (FOI) requests, compiling data from documents such as companies’ accounts, or working with partners to collect information from a range of sources.

But you’ll rarely hear the challenges of managing these projects discussed in resources on data journalism.

Last week I delivered a session on exactly those challenges to a factchecking team in Albania, so I thought it might be useful to share the tips from that session here.

They include some steps to take to reduce the likelihood of problems arising, while also helping to ensure a data entry project takes as little time as possible. Continue reading

Sigma Awards: new data journalism competition launched

Sigma awards

Data journalists are being invited to enter a new data journalism award, launched to “celebrate the best data journalism around the world [and] to empower, elevate and enlighten the global community of data journalists.”

The Sigma Awards were created by Aron Pilhofer and Reginald Chua, with support from Marianne Bouchart and Google’s Simon Rogers. Bouchart managed the Data Journalism Awards organised by the Global Editors Network, which closed last year.

There are nine awards across six categories:

  • Best data-driven reporting (small and large newsrooms)
  • Best visualisation (small and large newsrooms)
  • Innovation (small and large newsrooms)
  • Young journalist
  • Open data; and
  • Best news application

Aside from a trophy, up to two people from each winning project will receive an all-expenses-covered trip to the International Journalism Festival in Perugia on 1–5 April 2020 where the awards will be celebrated.

The organisers hope that winners will “participate in and lead data journalism panels, discussions and workshops” at the festival.

Entries to the competition are open until 3 February 2020 at 11:59 pm ET via an online form.

FAQ: How can journalism lecturers keep up with a fast-changing industry?

Abigail Edge teaching at BCU

Abigail Edge teaches a guest workshop on advanced Google tools in BCU’s newsroom

The latest frequently asked questions post is an answer to Ian Silvera who asks a number of questions about teaching journalism within the context a fast-changing industry. You can read his post here.

How do you think journalism lecturers should keep up with the fast-changing industry?

Following the industry press is pretty essential for anyone teaching in the field. Sites like Journalism.co.uk and Niemanlab are especially good at covering developments, but there’s also InPublishing and HoldtheFrontPage who cover it more broadly including new technologies and issues. And tons of email newsletters.

It’s easier than ever to follow individuals inside the industry, too – on Twitter as well as professional blogs, Medium.com and anywhere else. I maintain Twitter lists of people reporting in particular fields or in particular roles, for example, and generate Nuzzel newsletters for those lists so I’m up to date with what they’re sharing. Continue reading